MATLAB style stem plot with R
Author: Matti Pastell
Tags:
R
Sep 11 2009
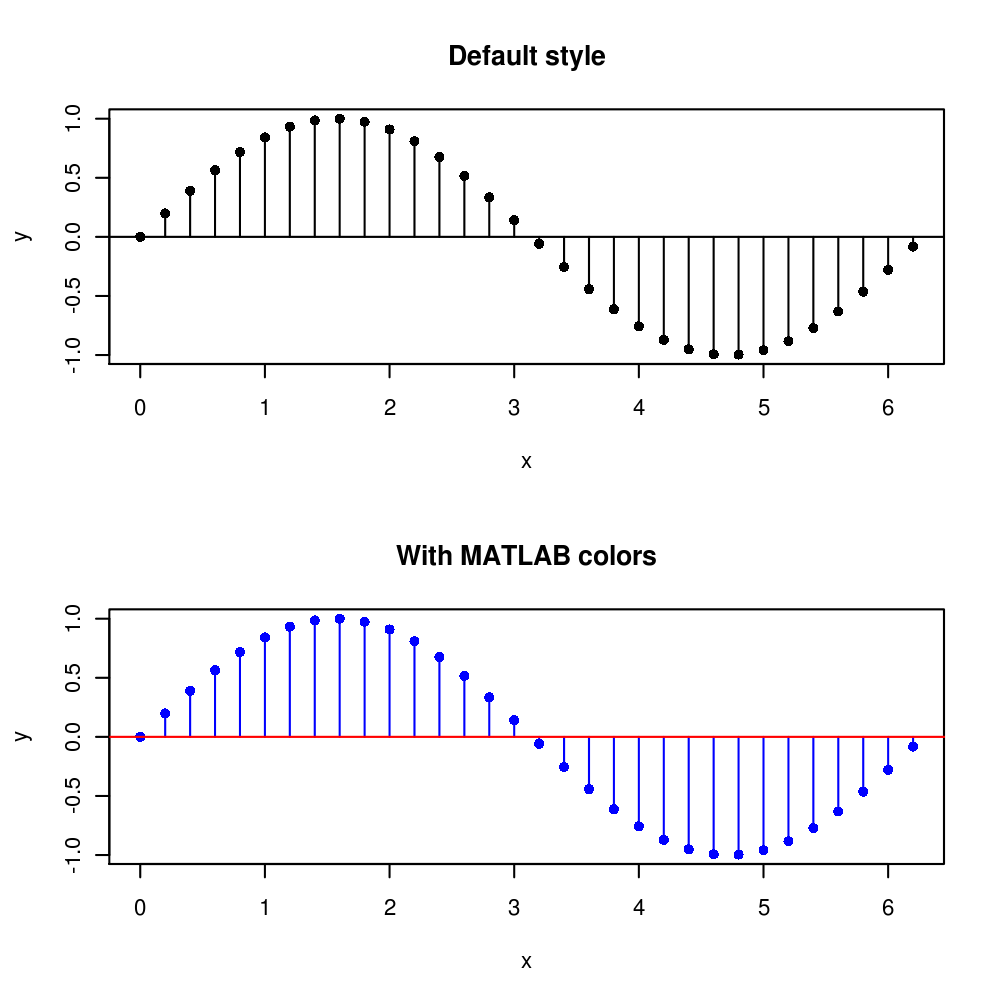
Recently I wanted to plot an impulse response function with R and missed the MATLAB style stem plot for doing it. I couldn’t find an R function for it with a quick Google search so I made my own. So here is the function and a small example:
#The function
stem <- function(x,y,pch=16,linecol=1,clinecol=1,...){
if (missing(y)){
    y = x
    x = 1:length(x) }
    plot(x,y,pch=pch,...)
    for (i in 1:length(x)){
       lines(c(x[i],x[i]), c(0,y[i]),col=linecol)
    }
    lines(c(x[1]-2,x[length(x)]+2), c(0,0),col=clinecol)
}

#An example
x <- seq(0, 2*pi, by = 0.2)
par(mfrow = c( 2, 1))
stem(x, sin(x), main = 'Default style')
stem(x, sin(x) ,main='With MATLAB colors', col= 4, linecol= 4, clinecol= 2)