Matplotlib colormaps with a surface plot
Author: Matti Pastell
Tags:
Python, Matplotlib, SciPy
May 02 2013
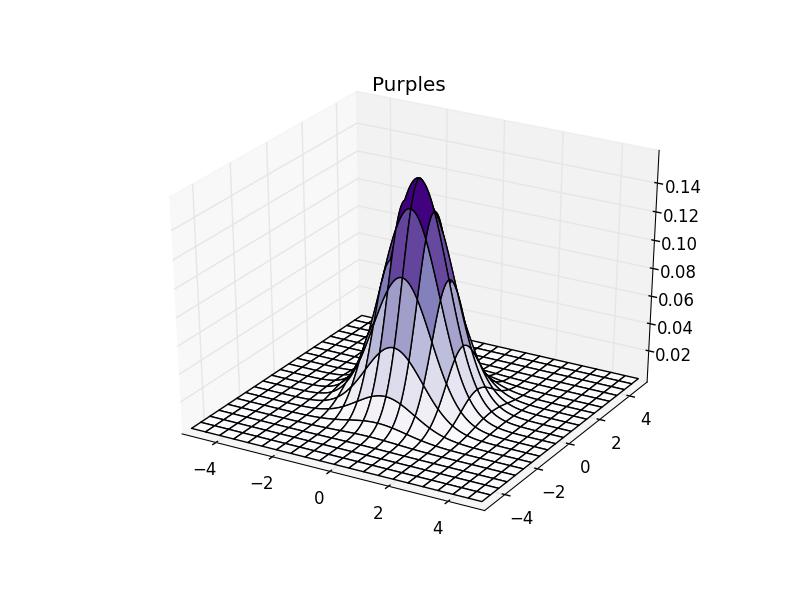
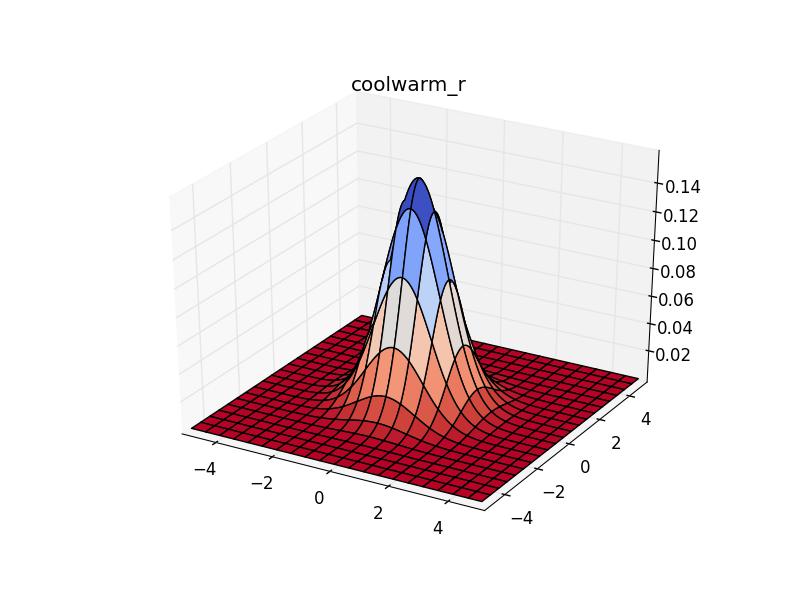
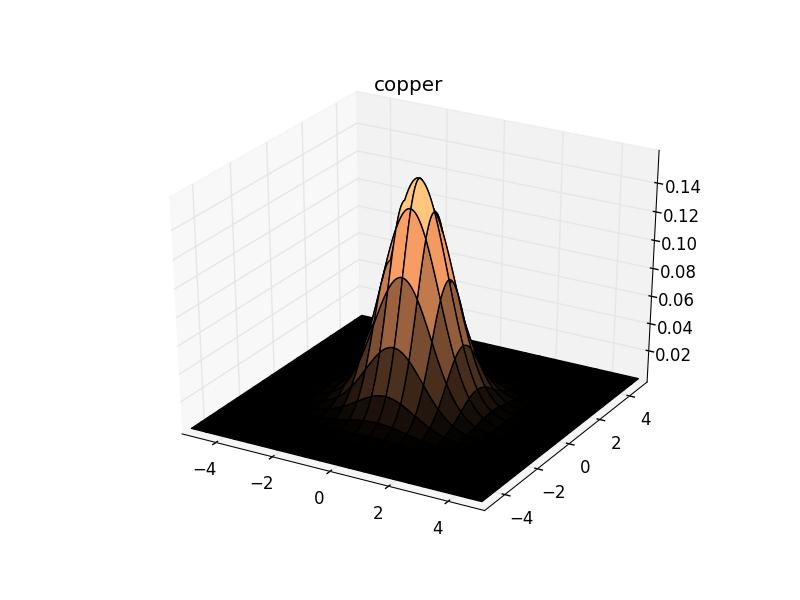
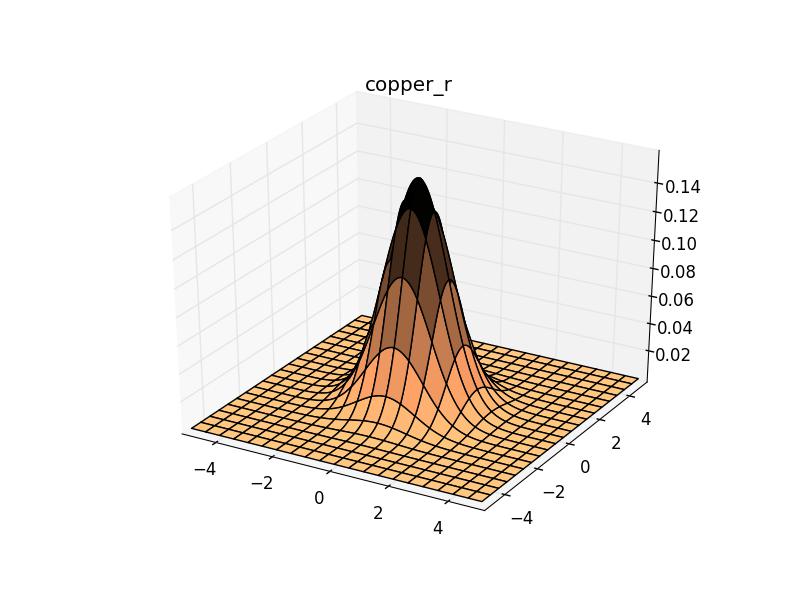
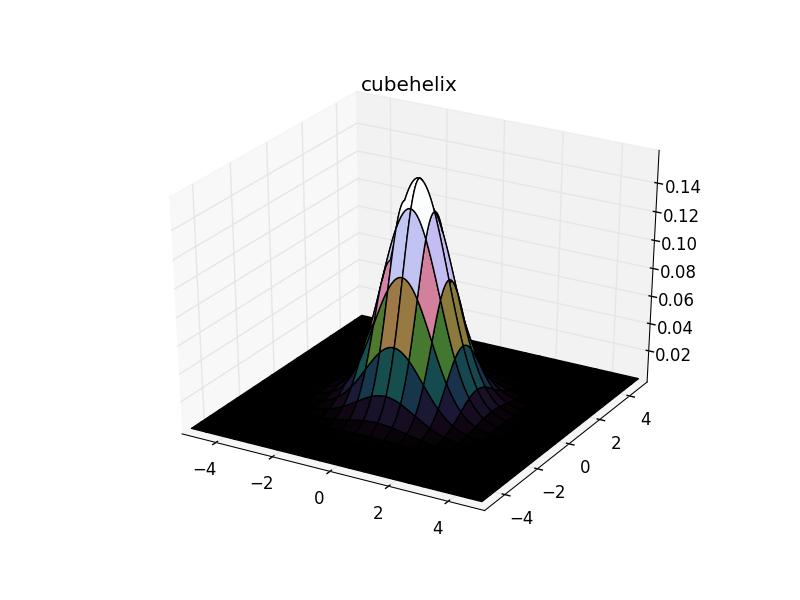
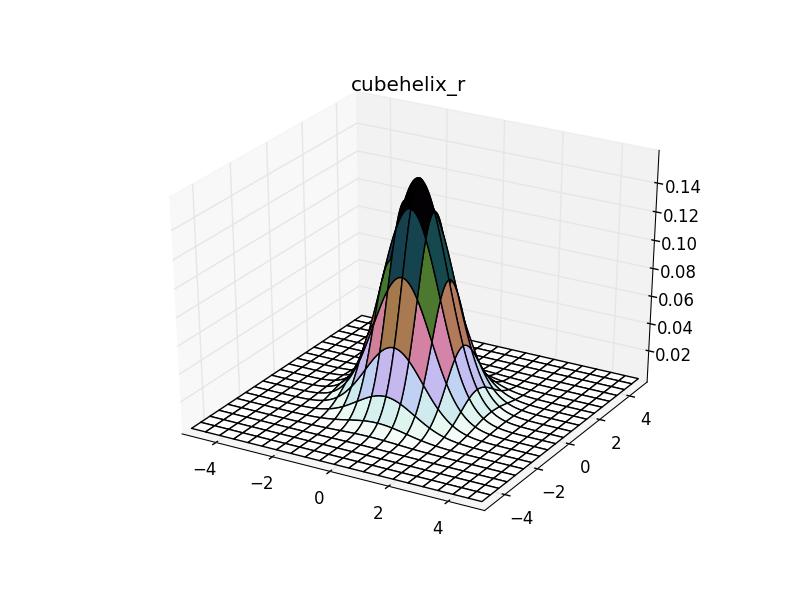
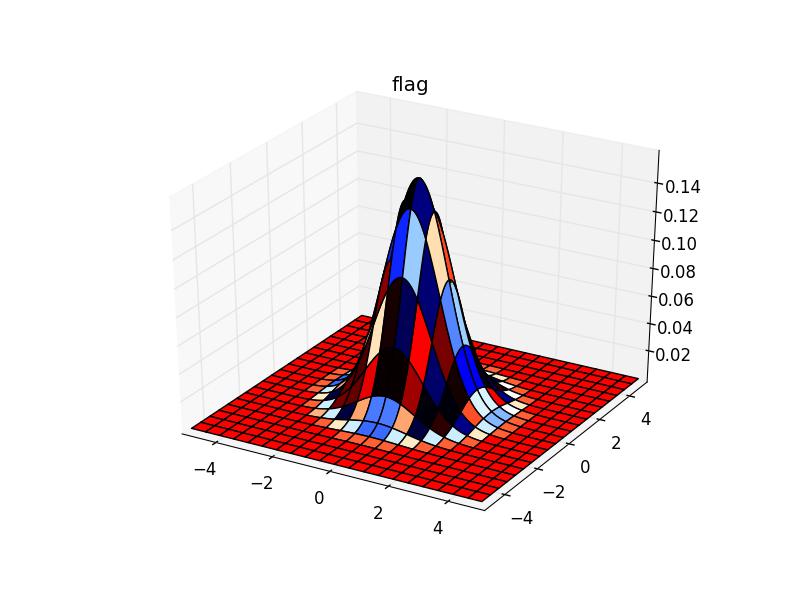
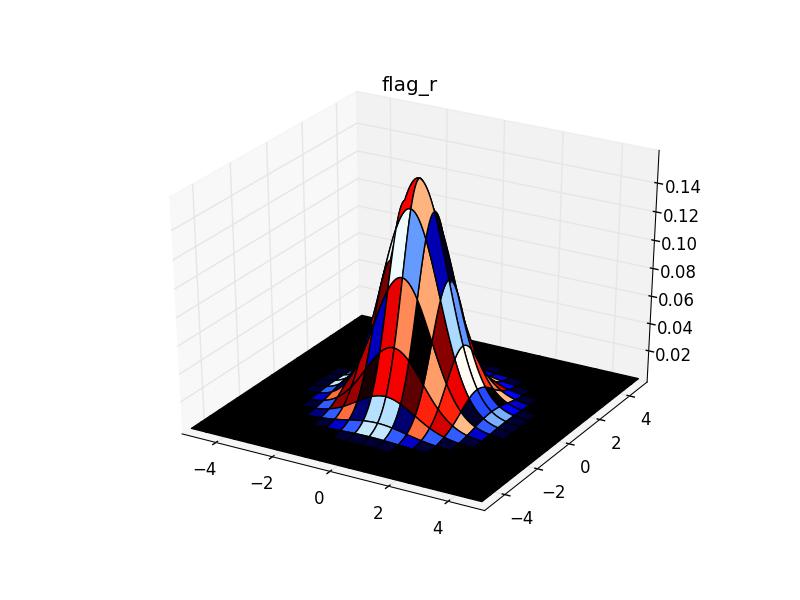
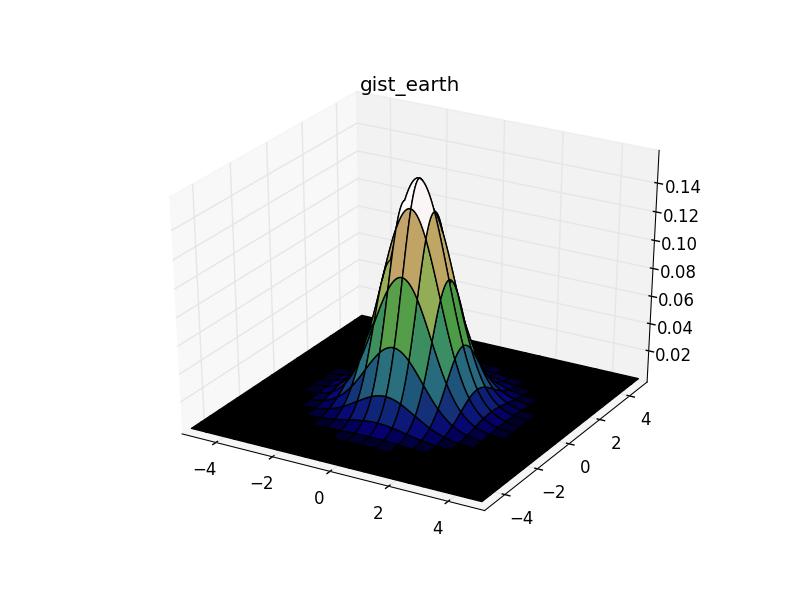
Today I was working on surface plots and wanted to know what different colormaps in Matplotlib look like. Luckily it was easy to find out and I decided to post results here in case someone else finds it useful.
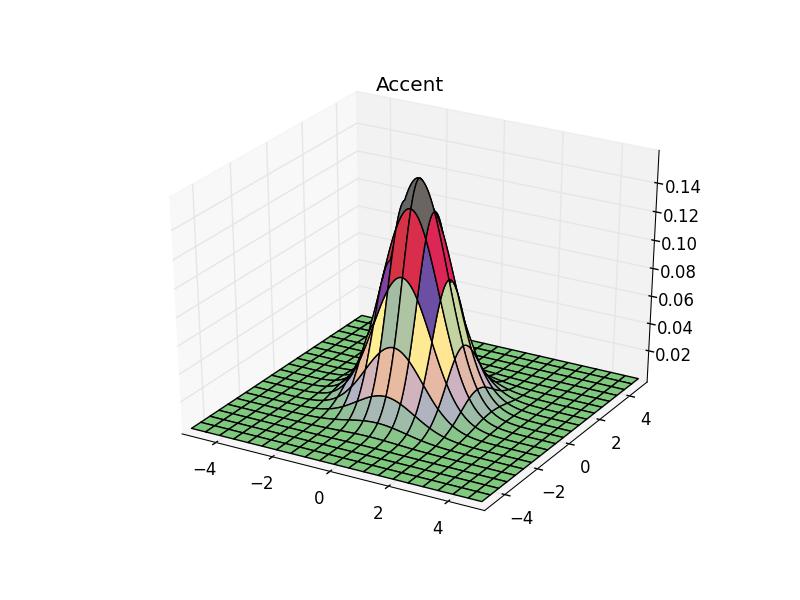
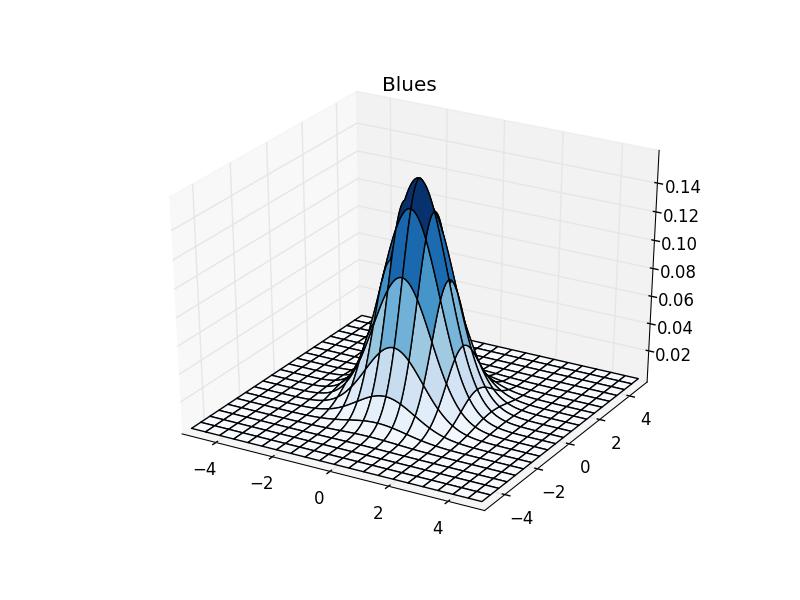
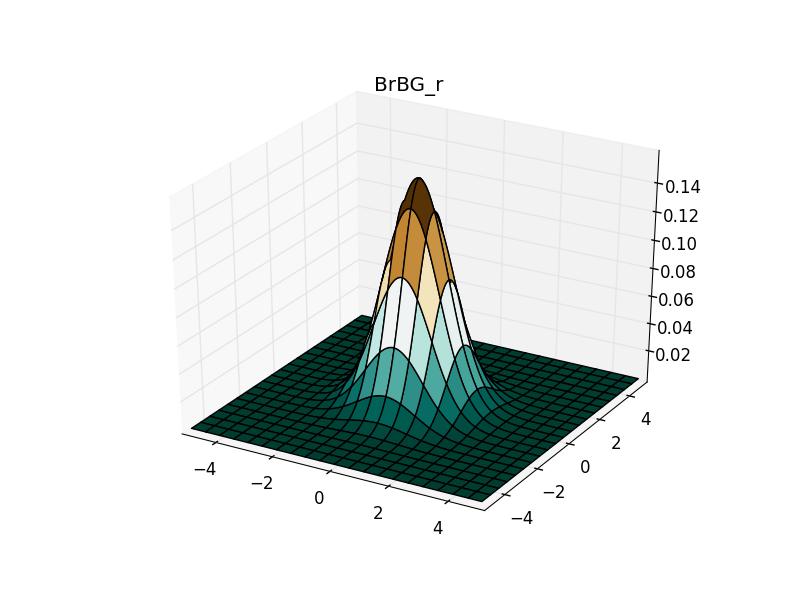
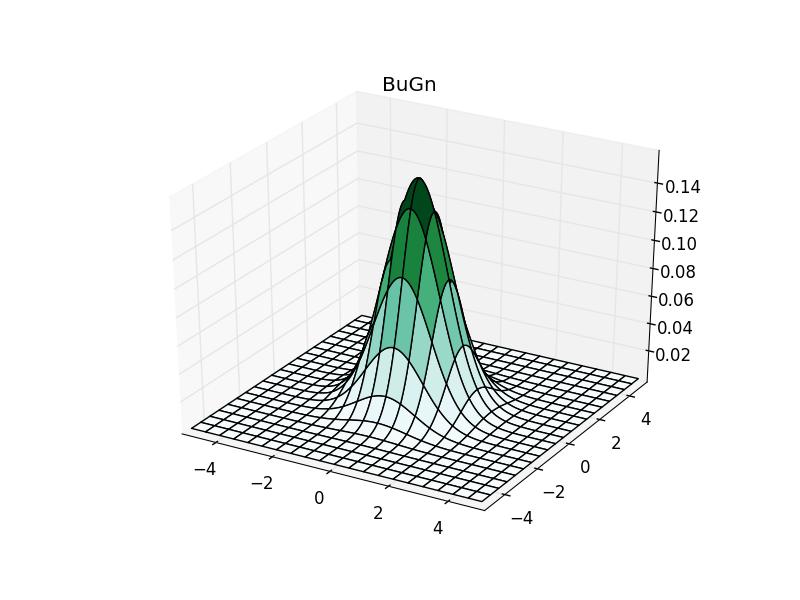
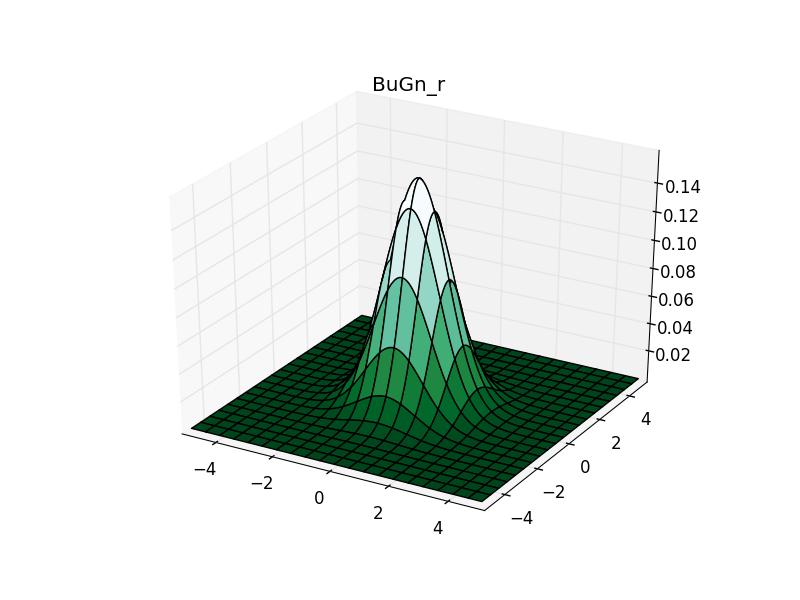
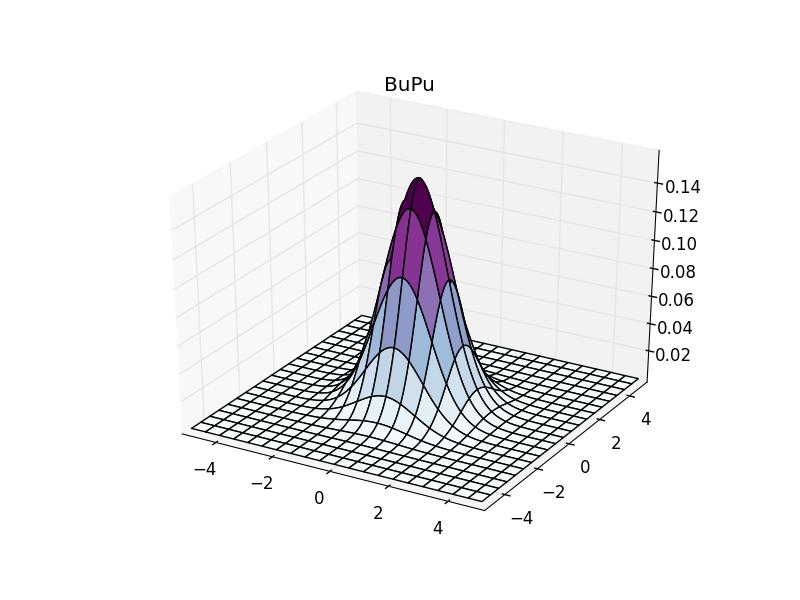
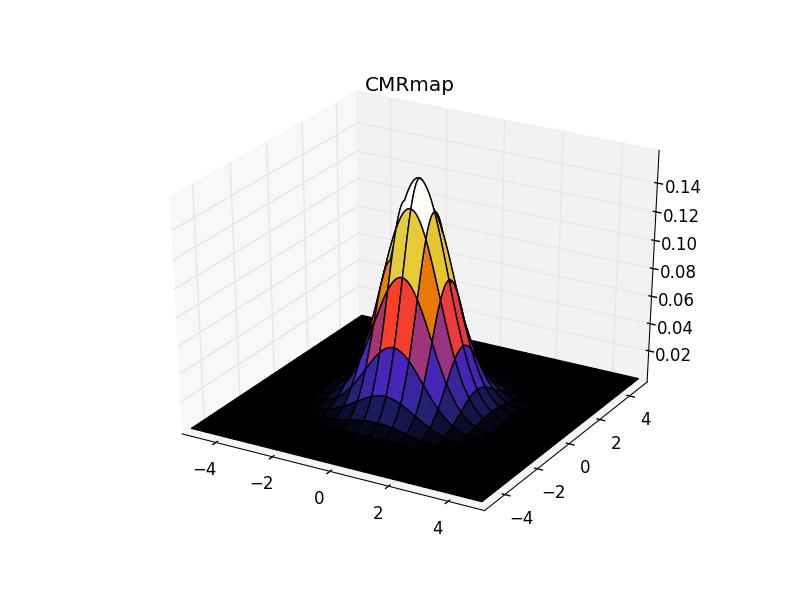
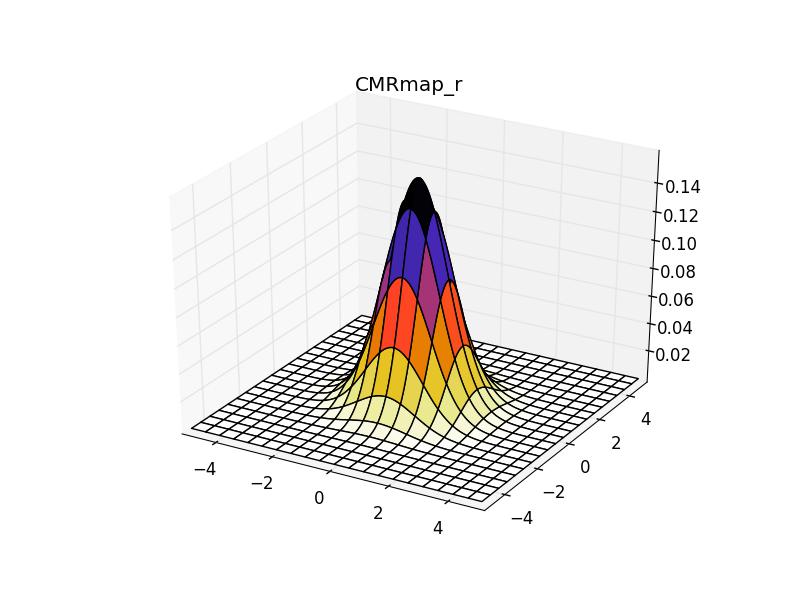
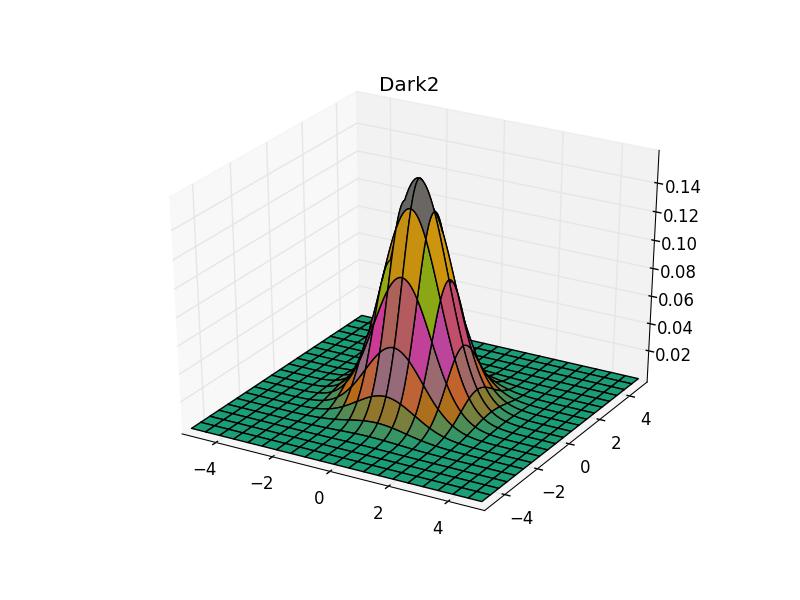
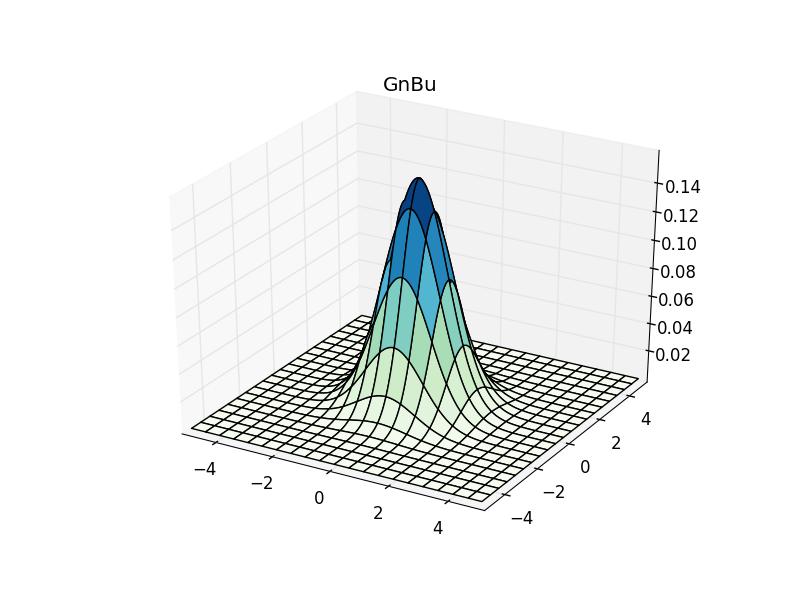
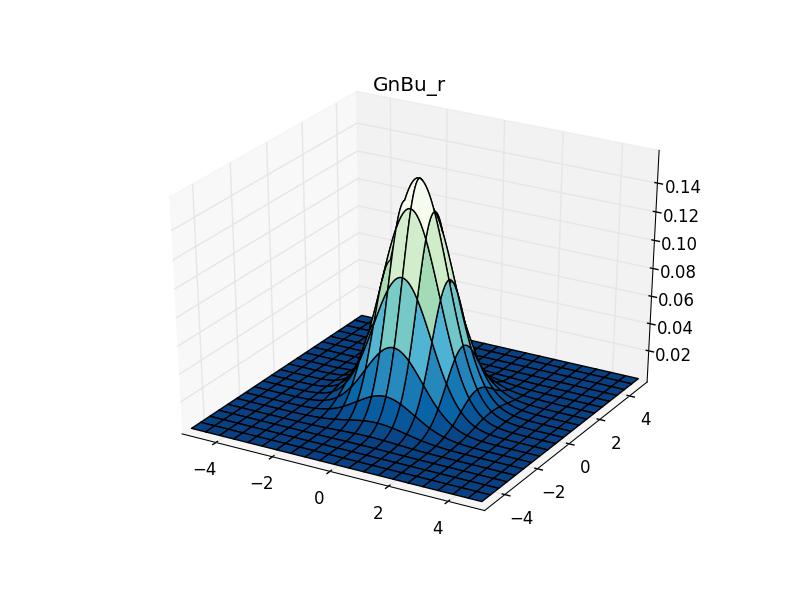
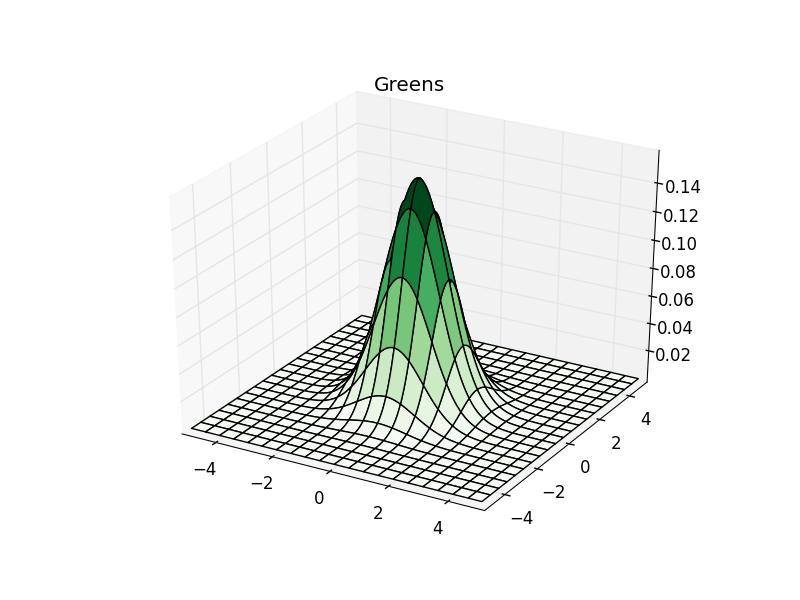
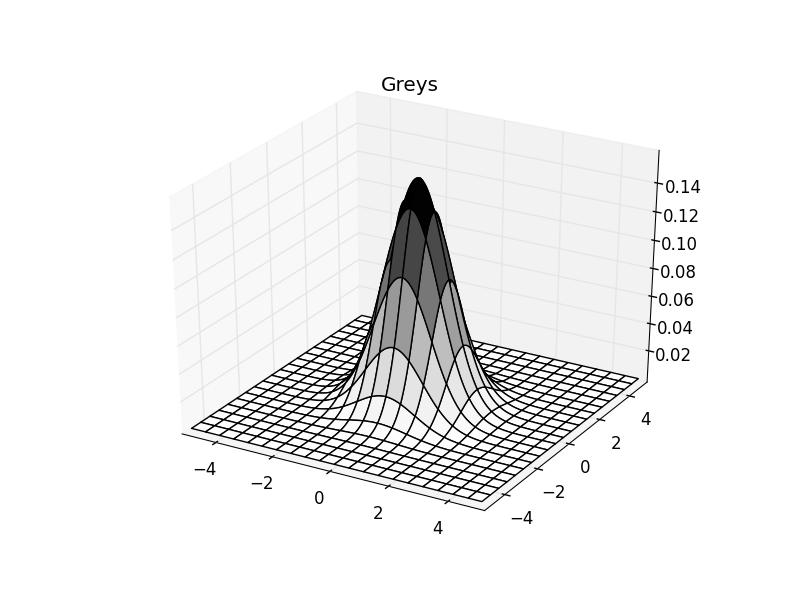
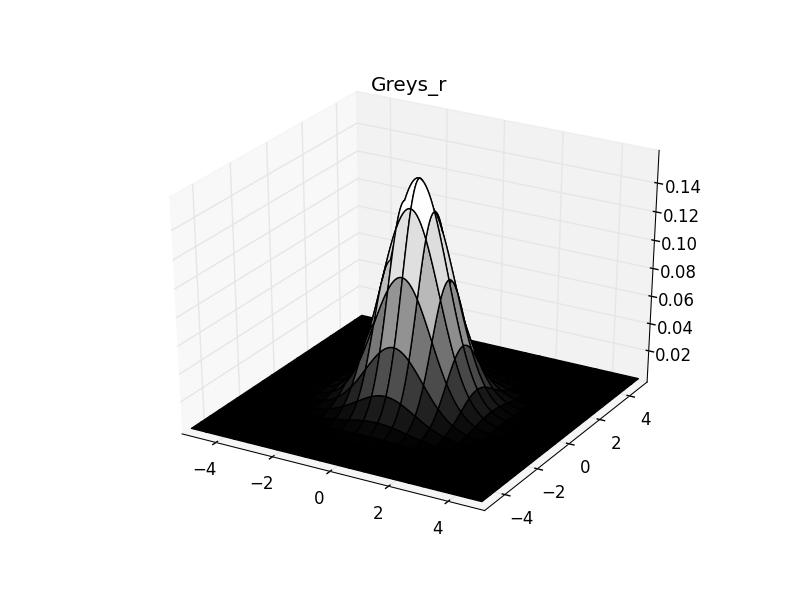
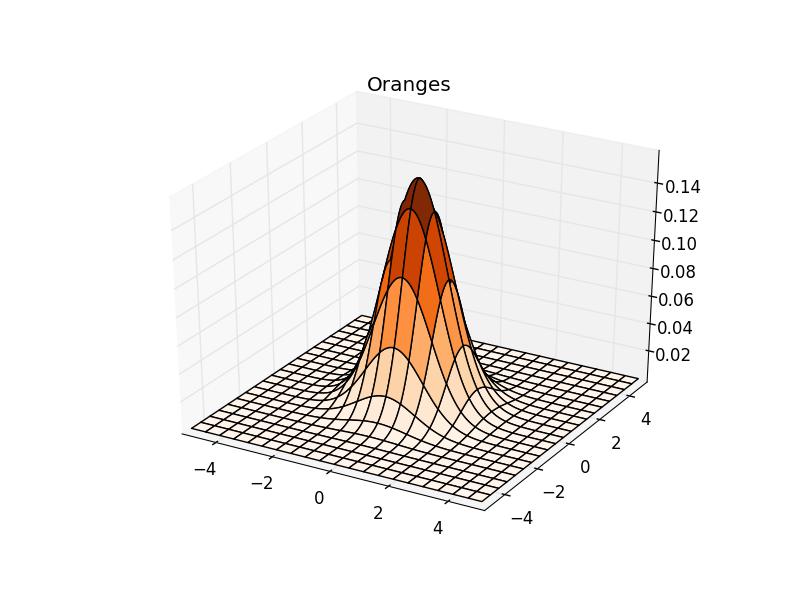
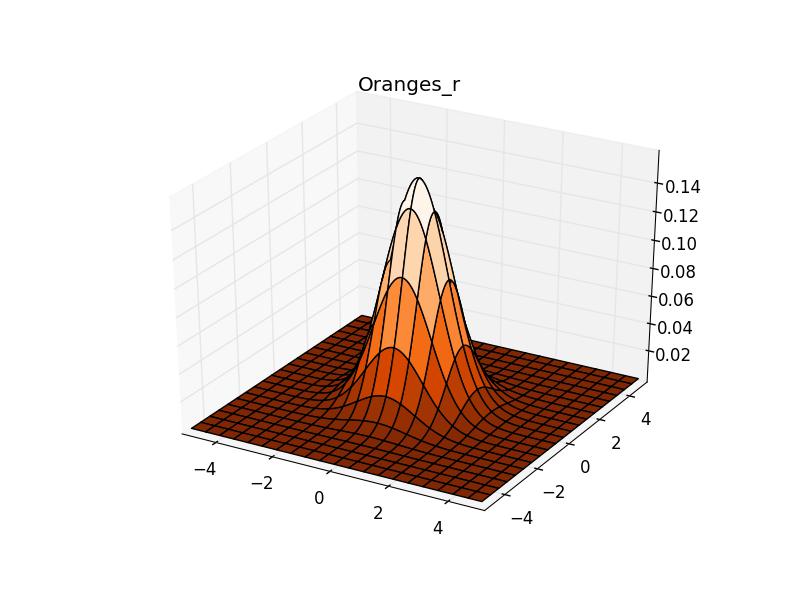
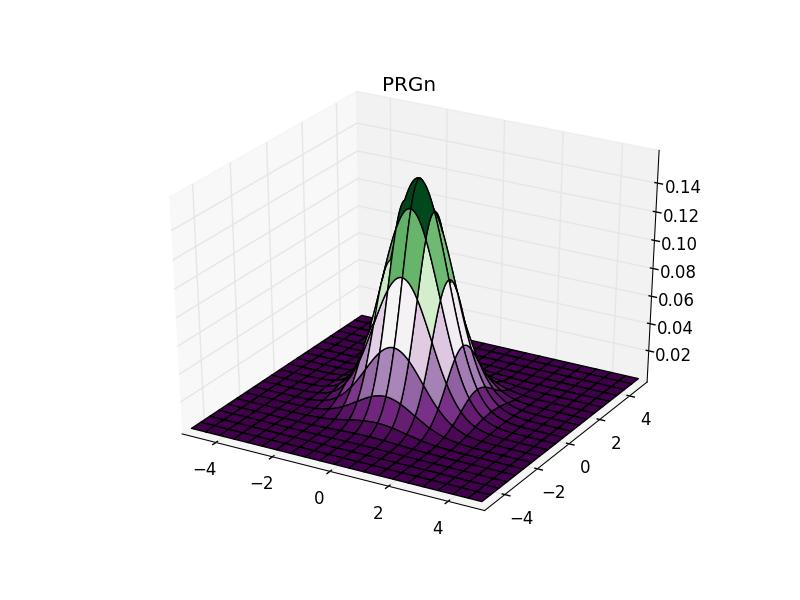
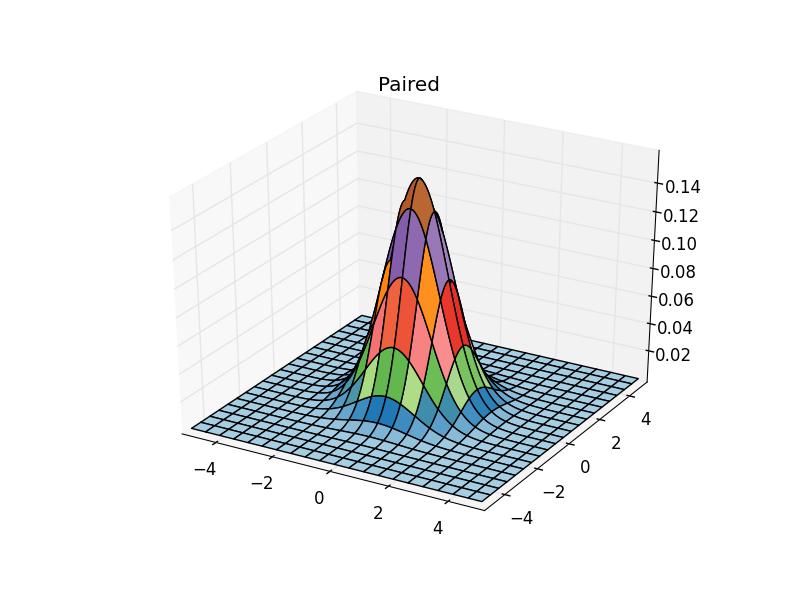
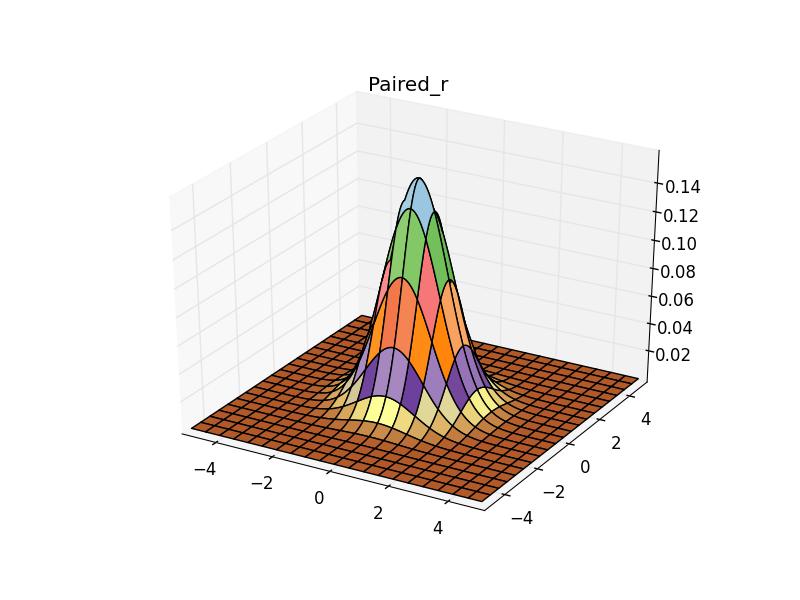
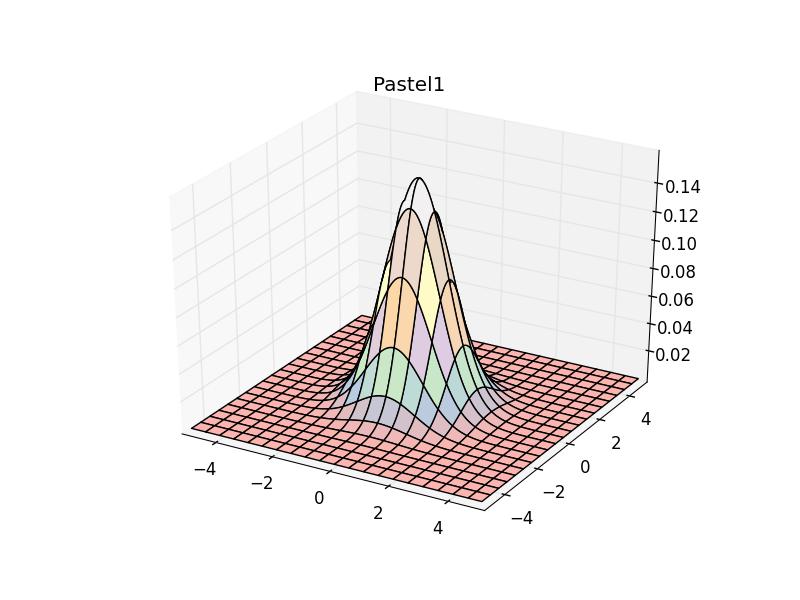
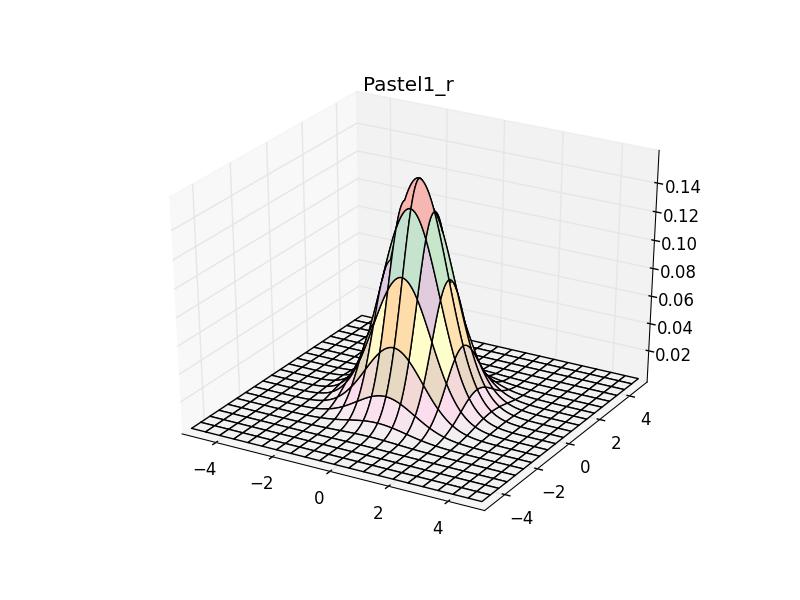
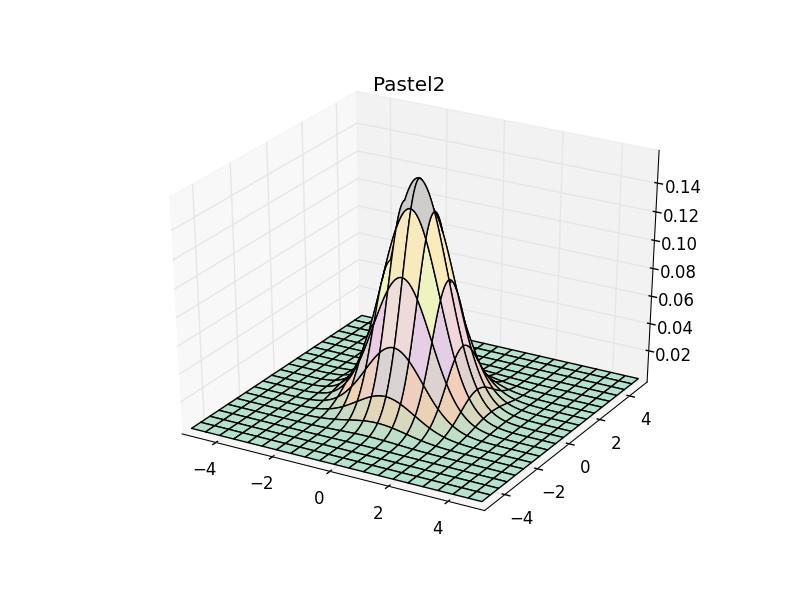
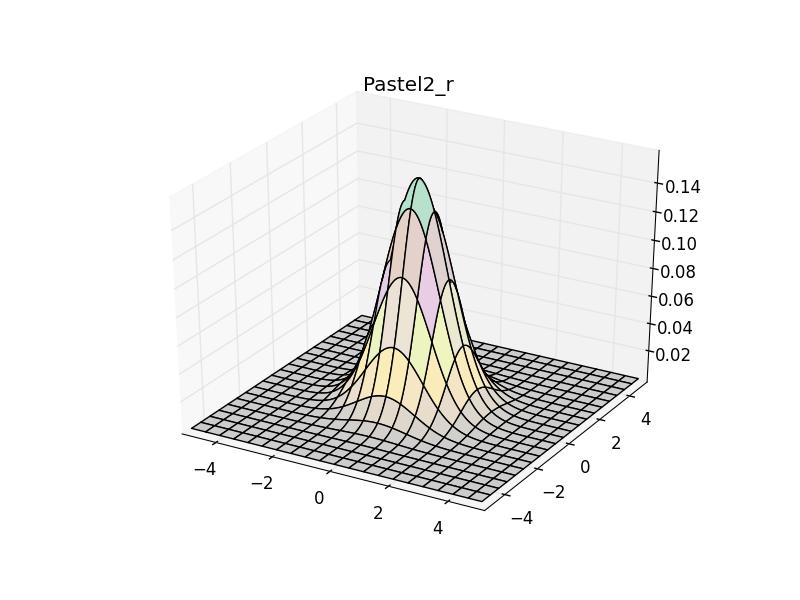
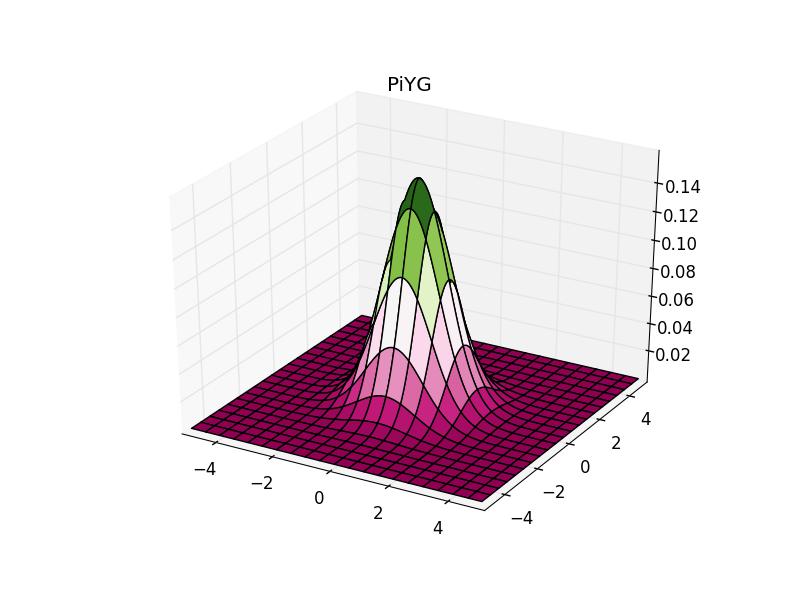
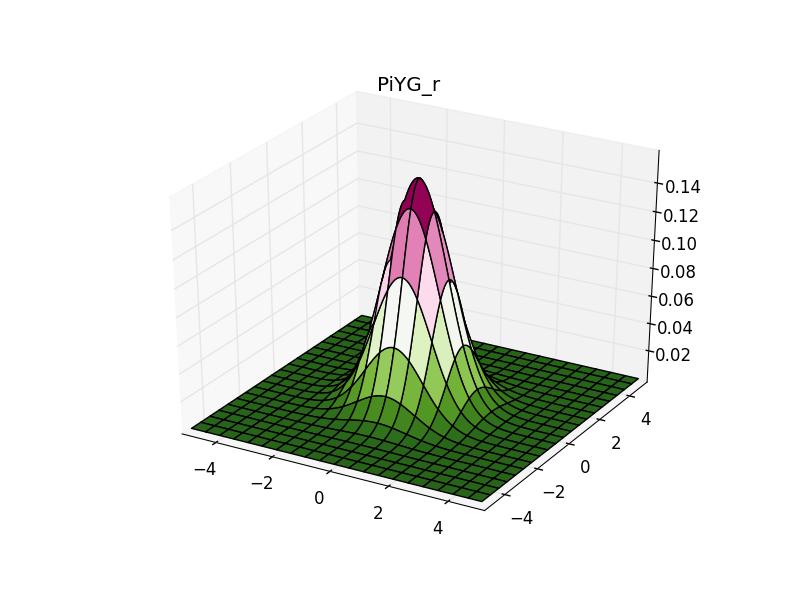
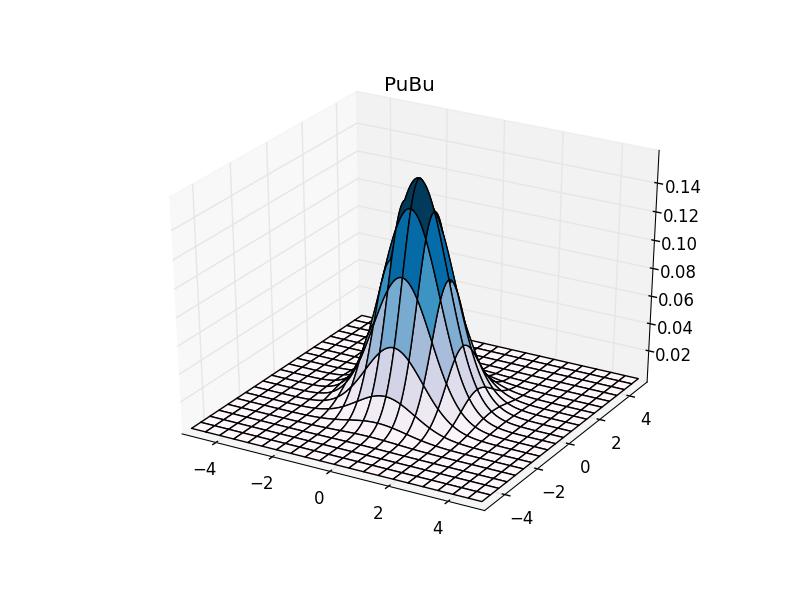
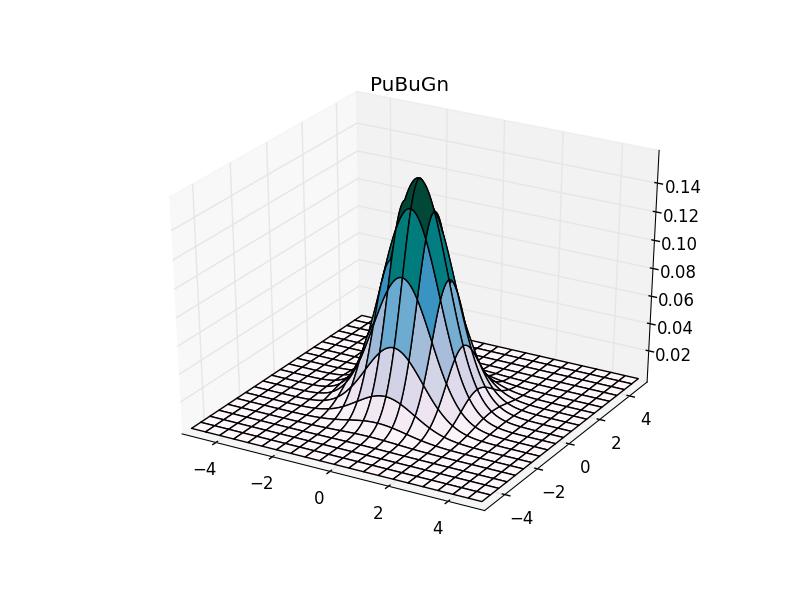
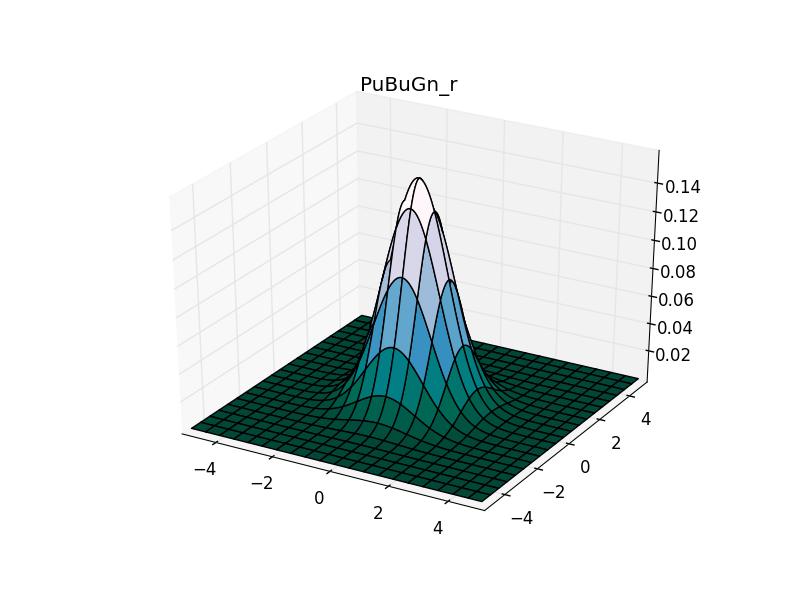
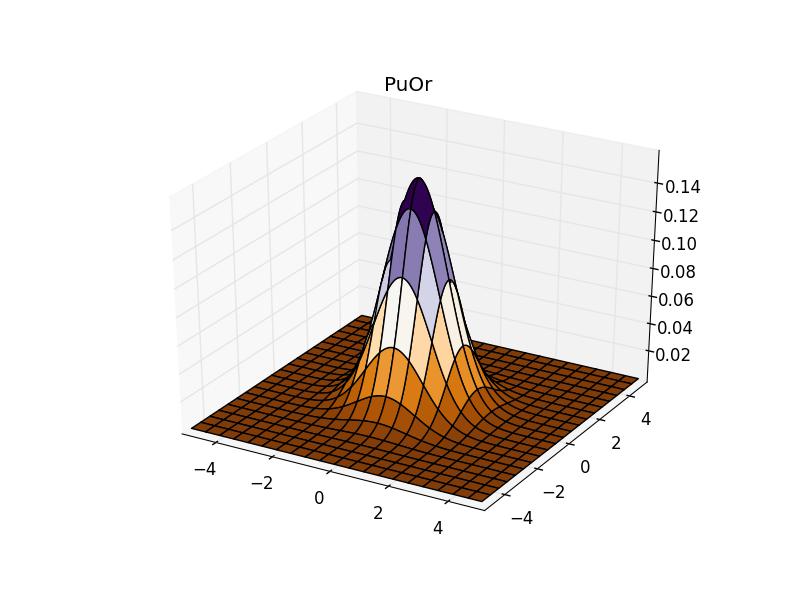
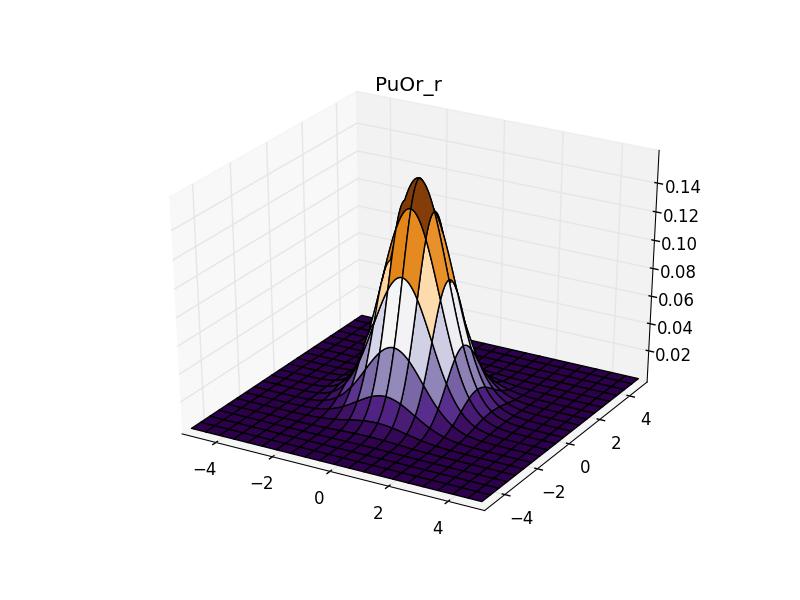
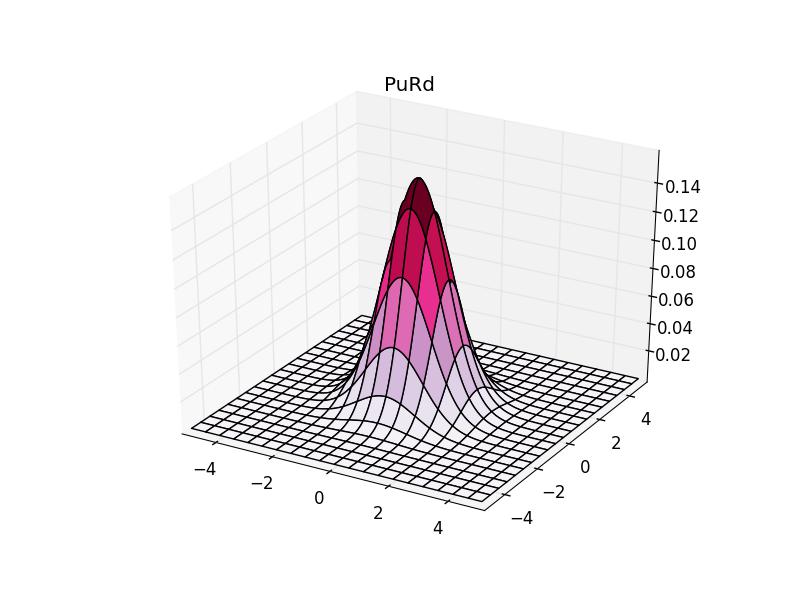
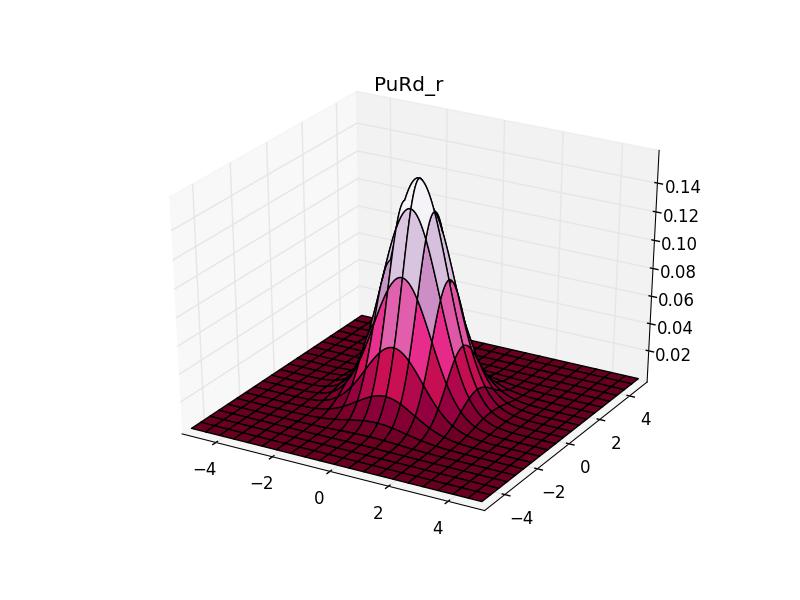
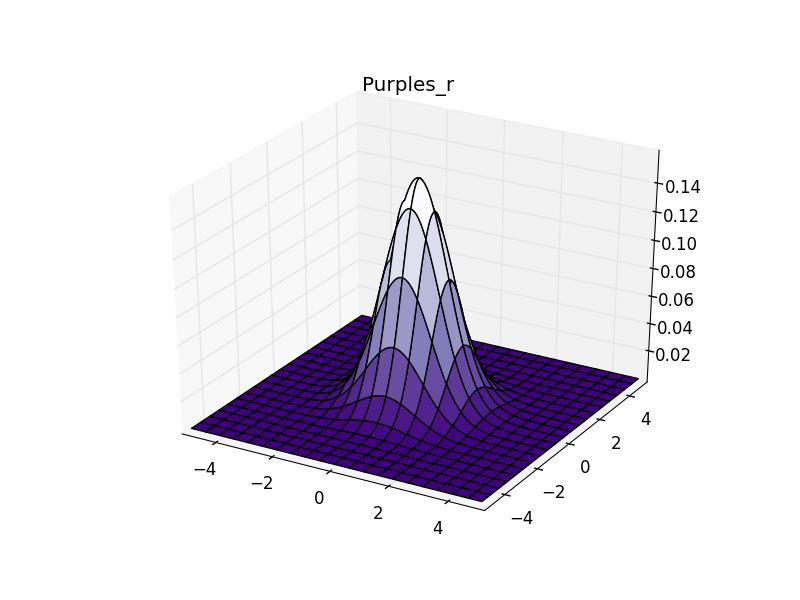
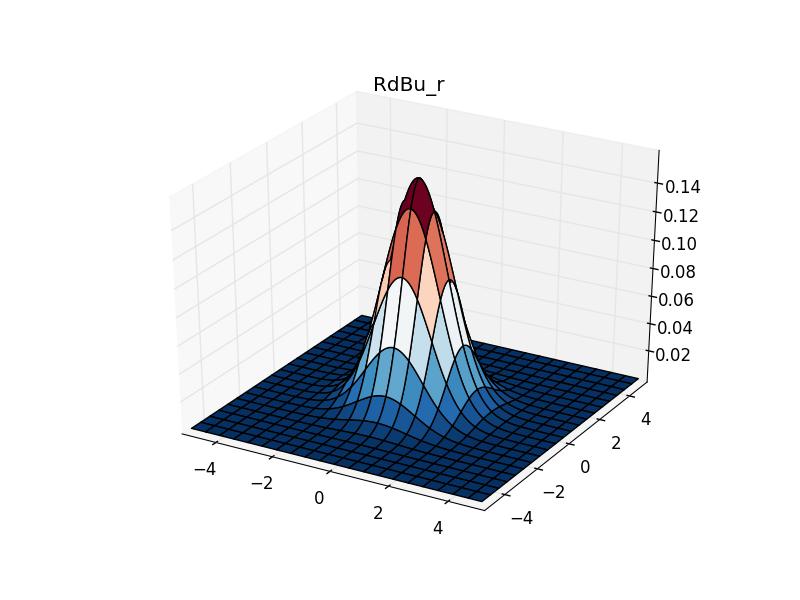
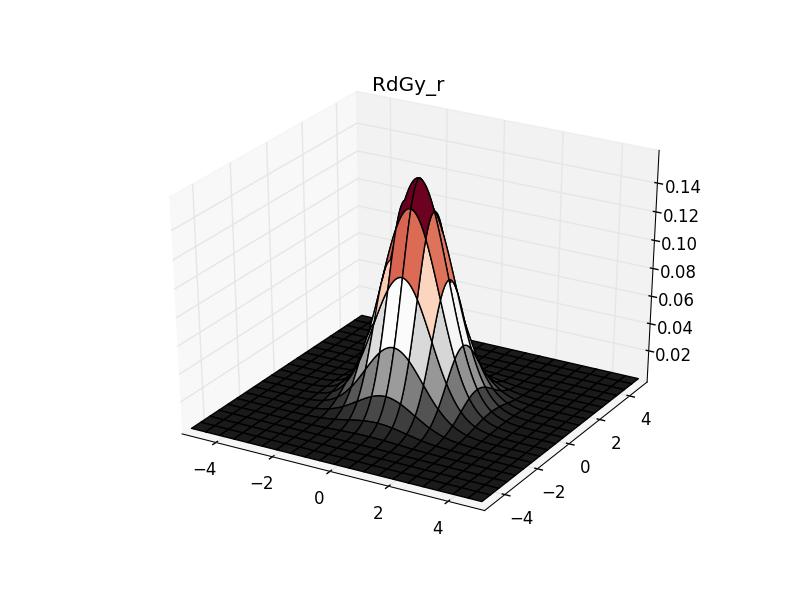
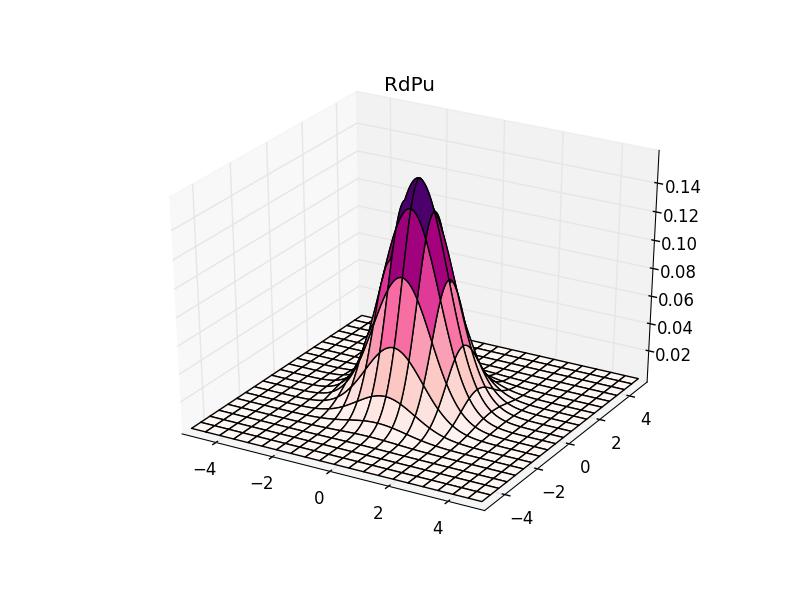
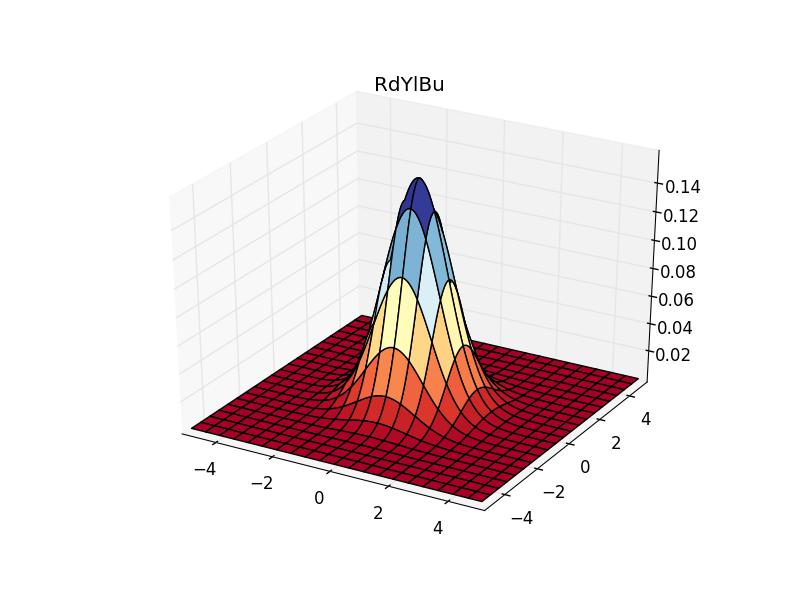
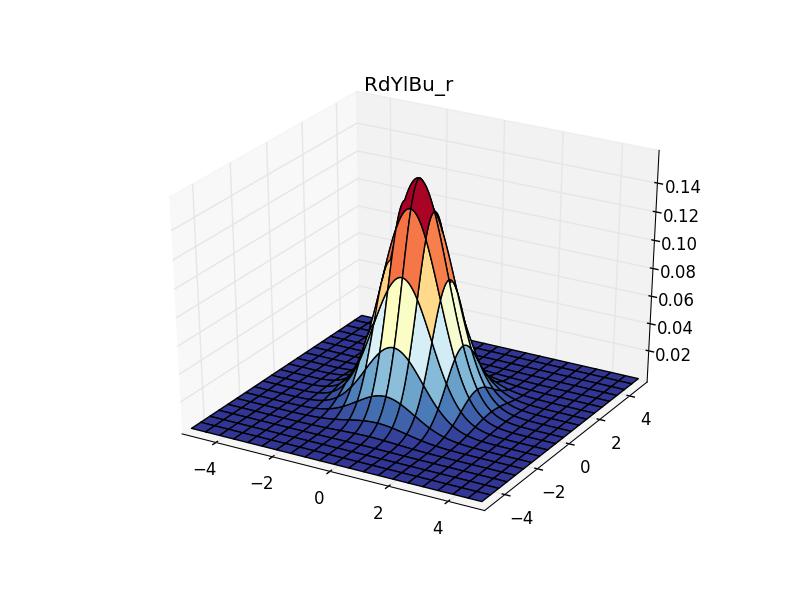
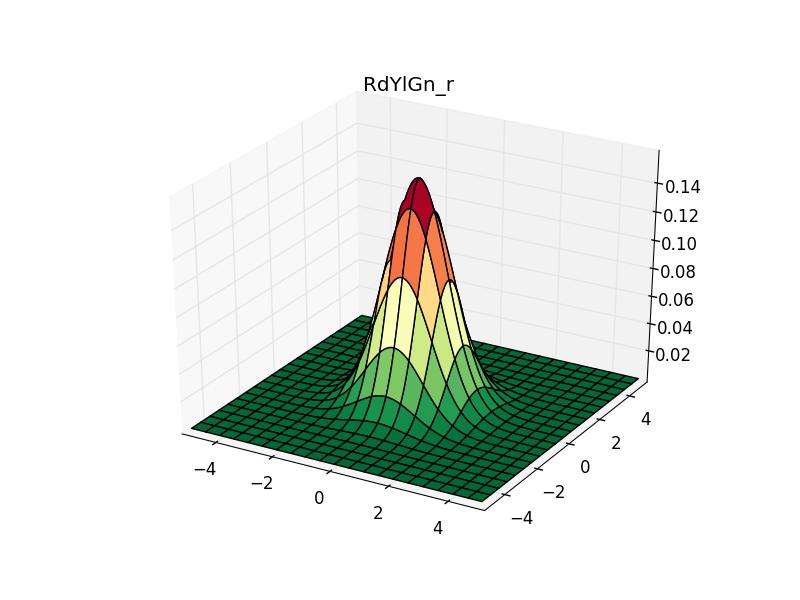
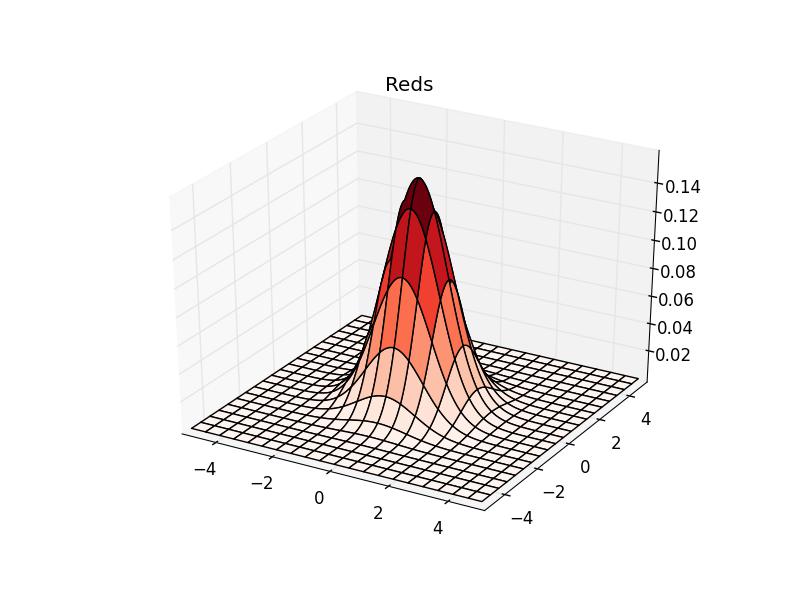
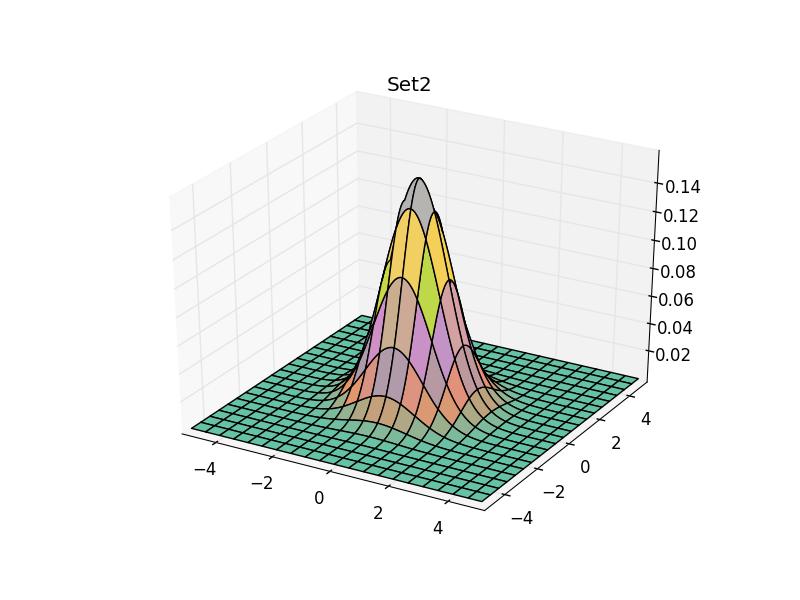
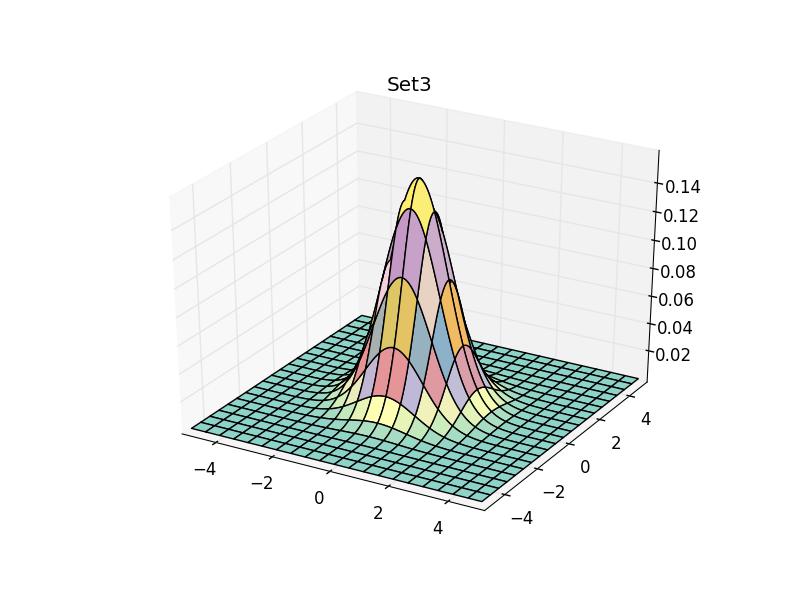
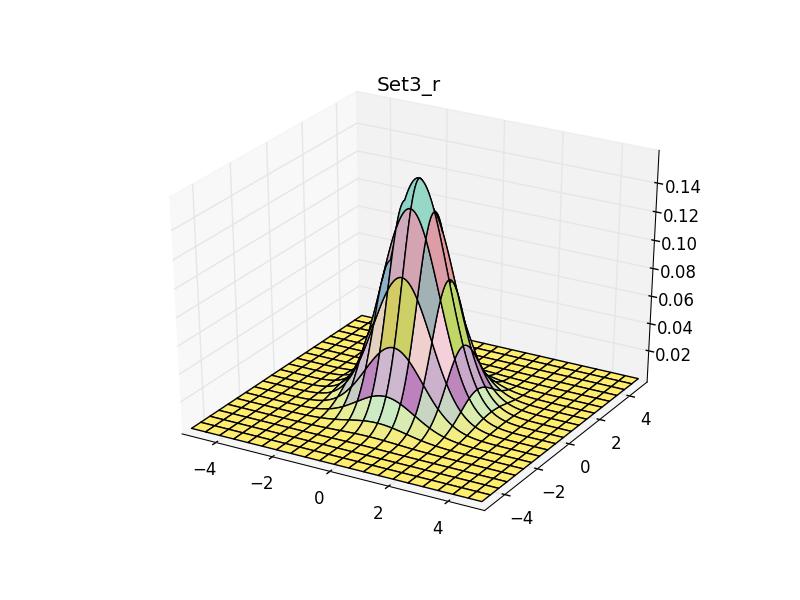
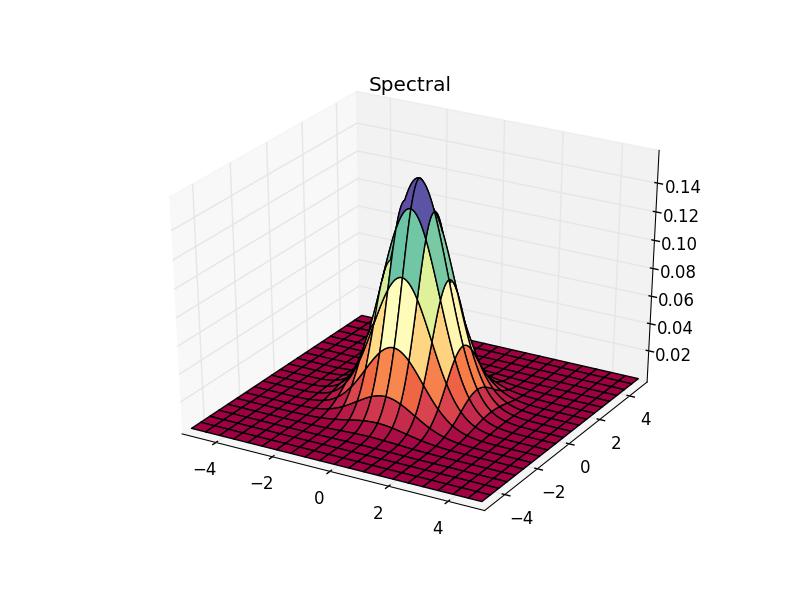
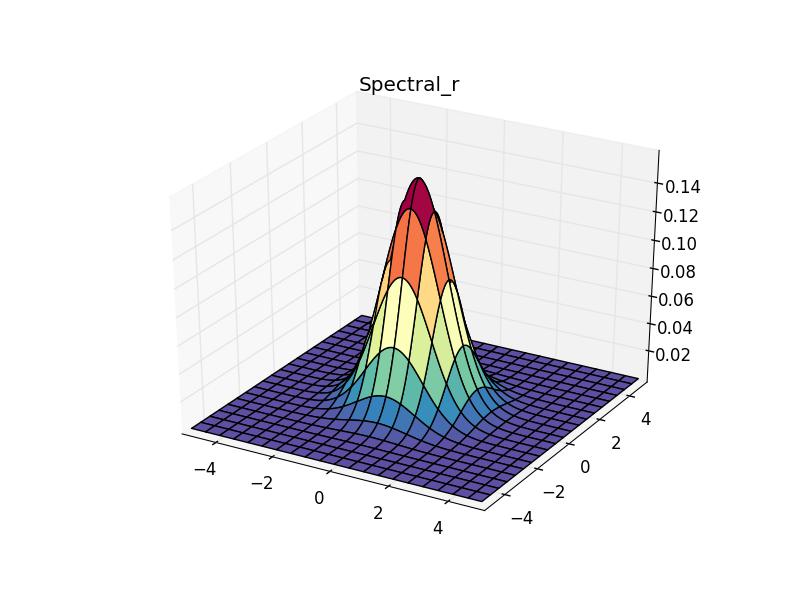
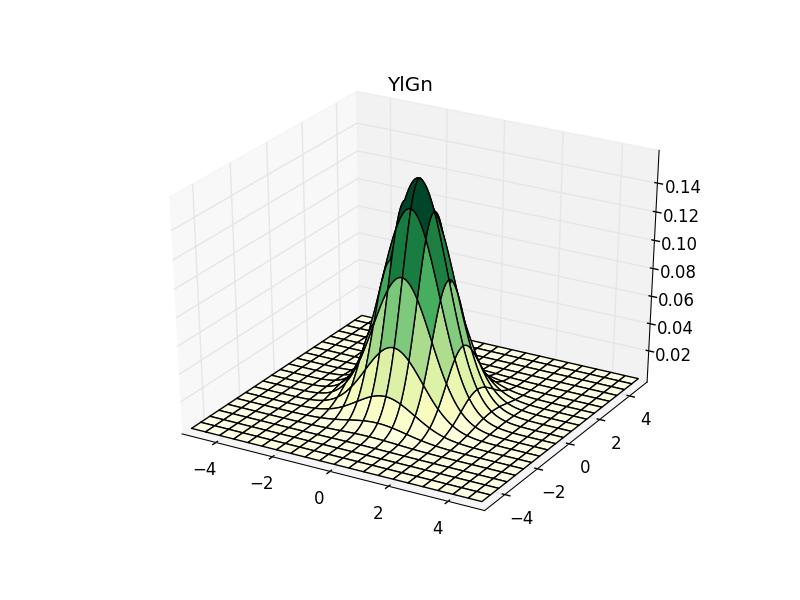
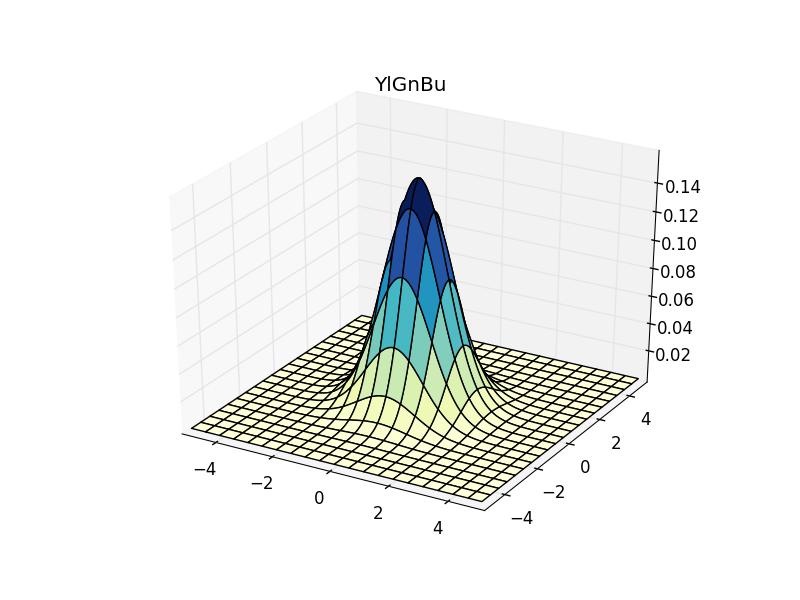
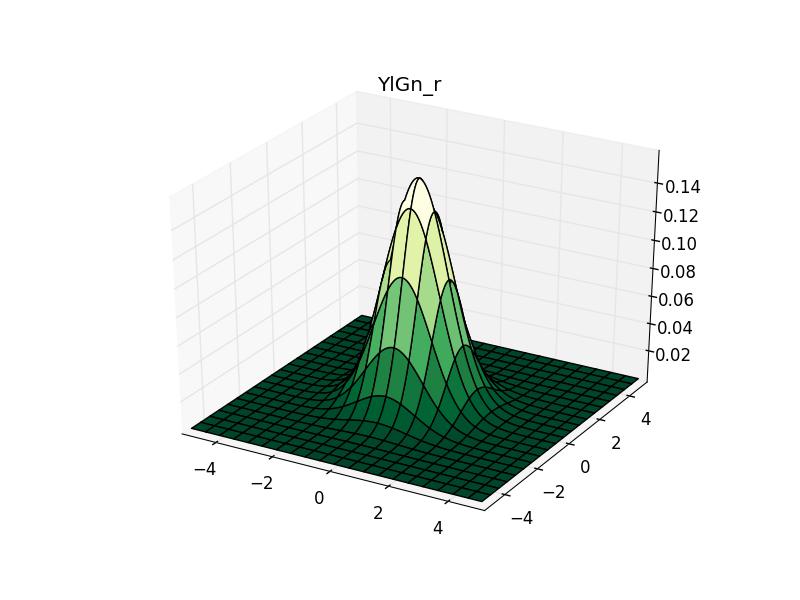
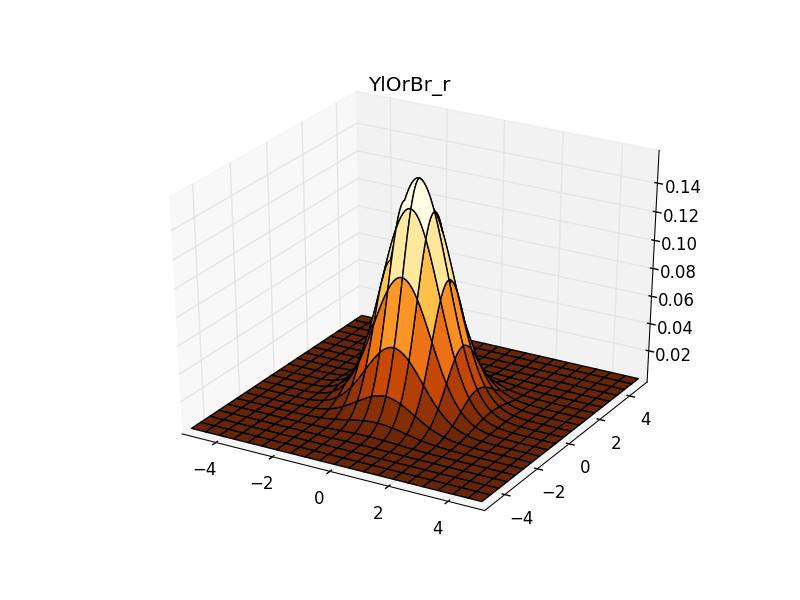
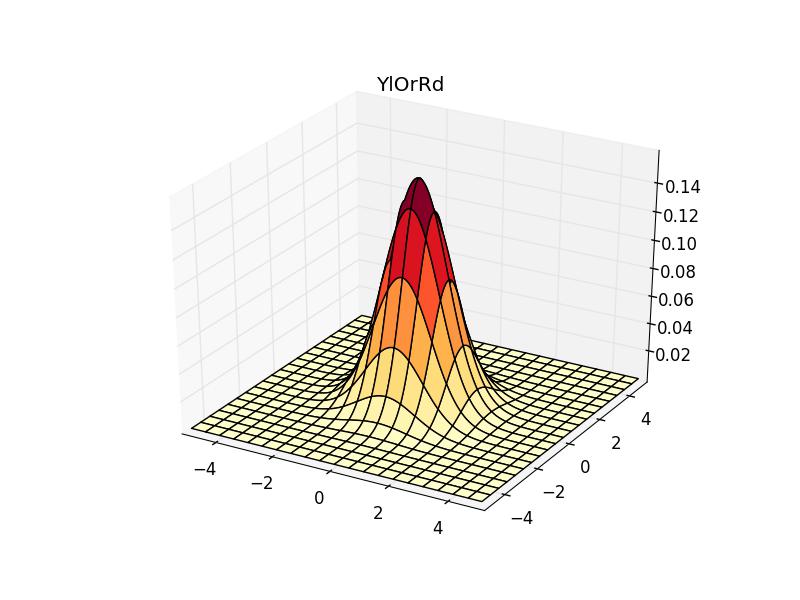
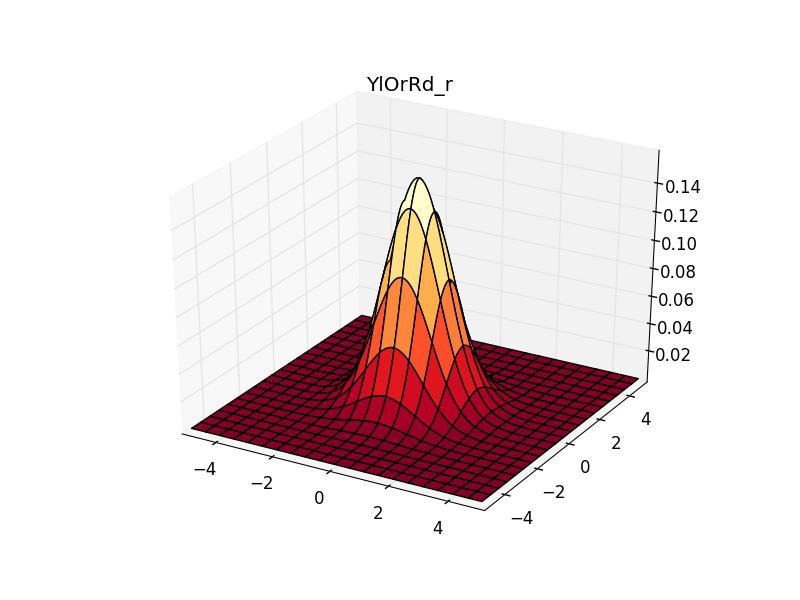
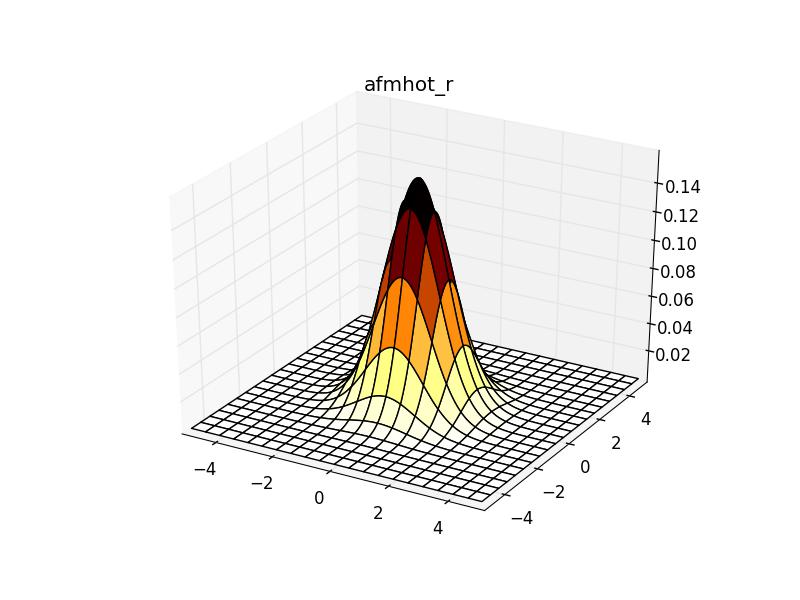
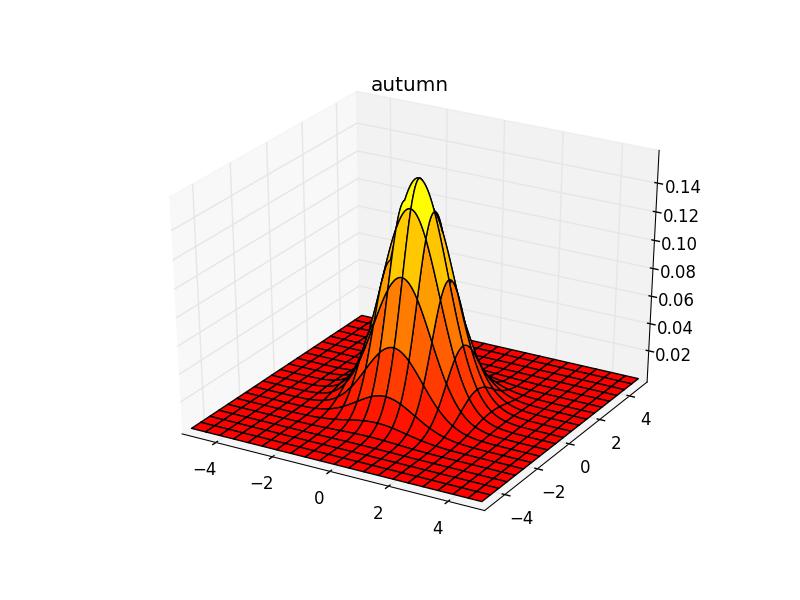
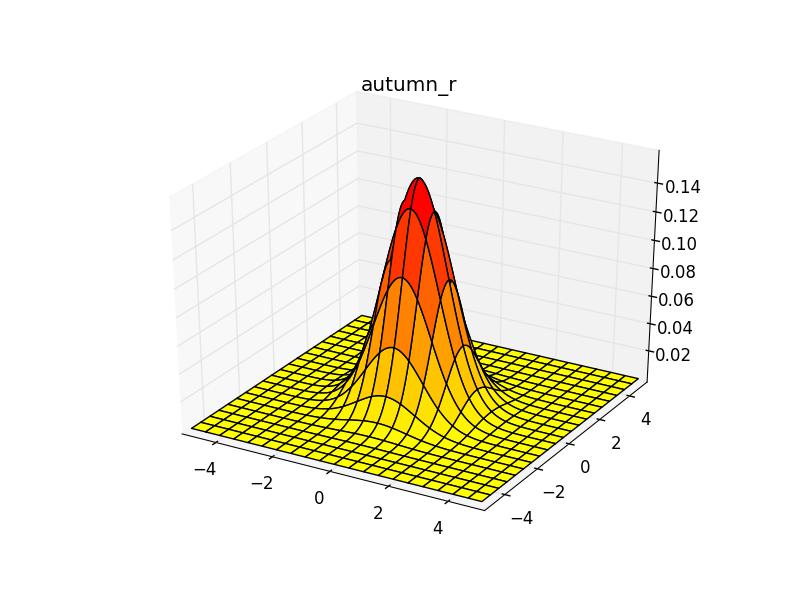
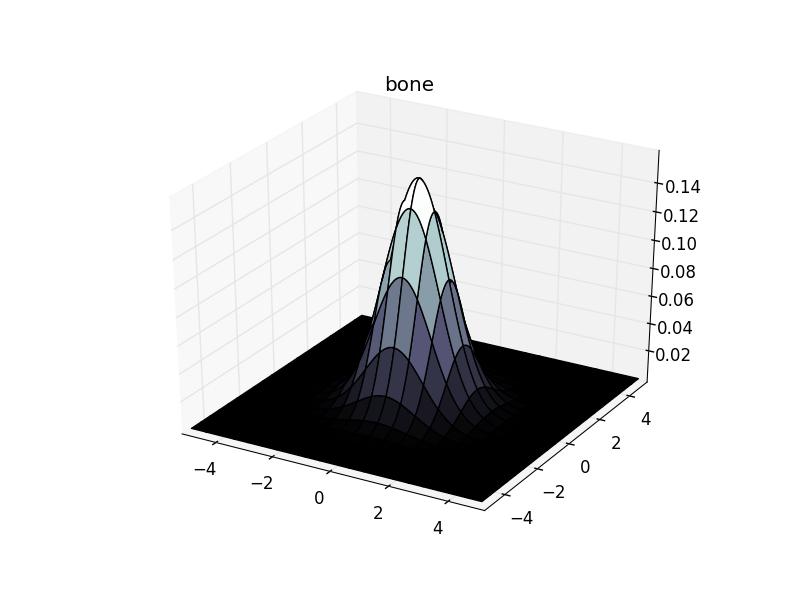
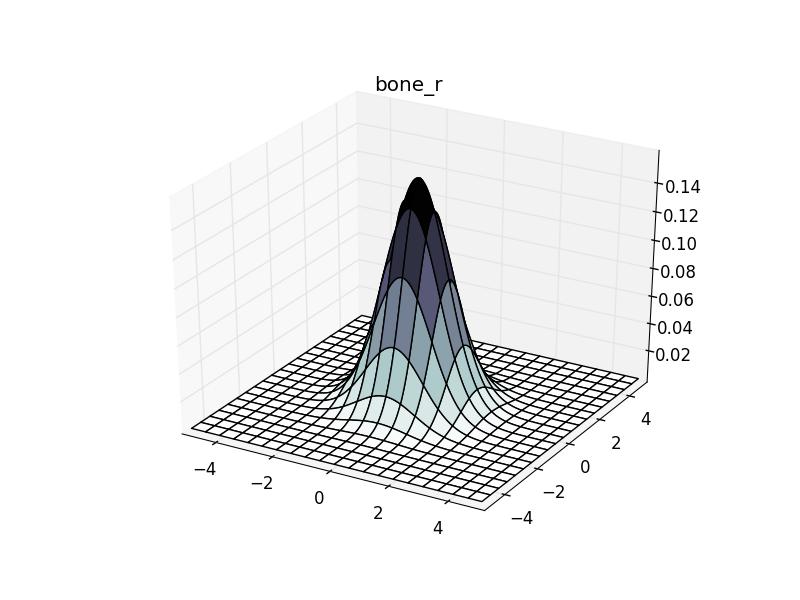
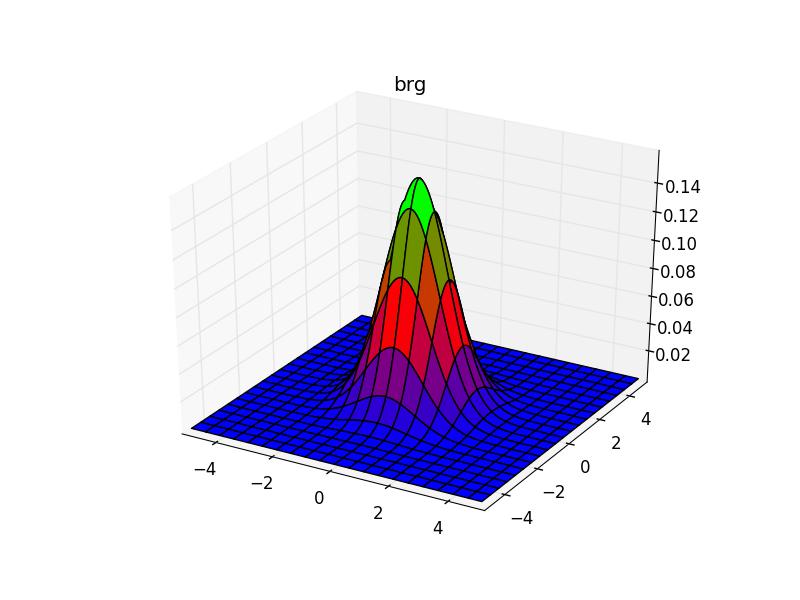
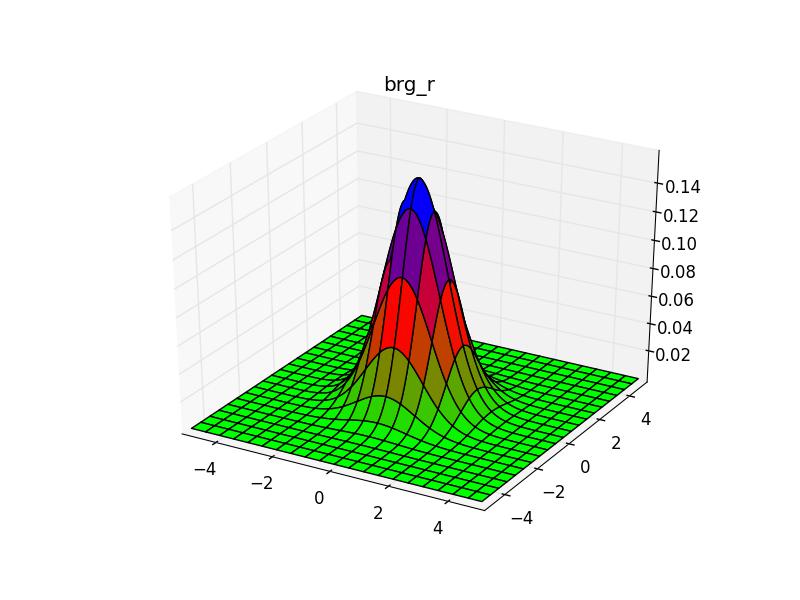
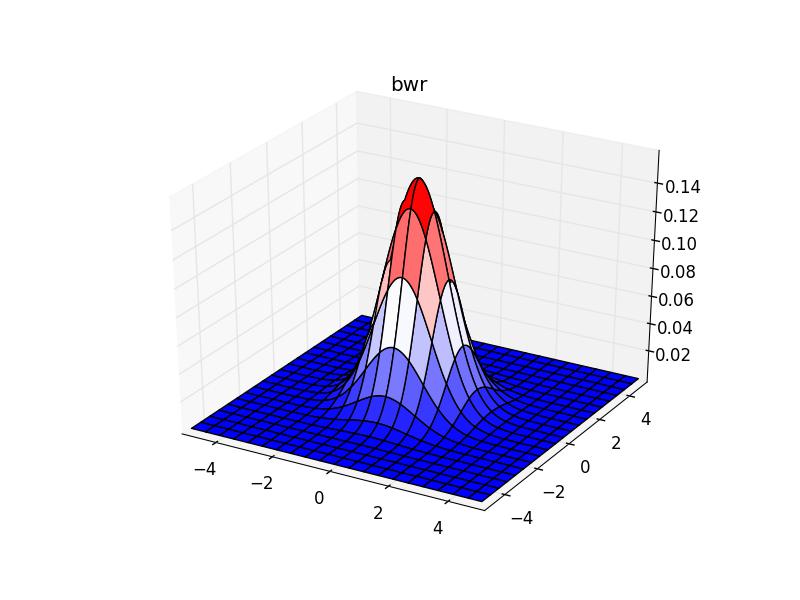
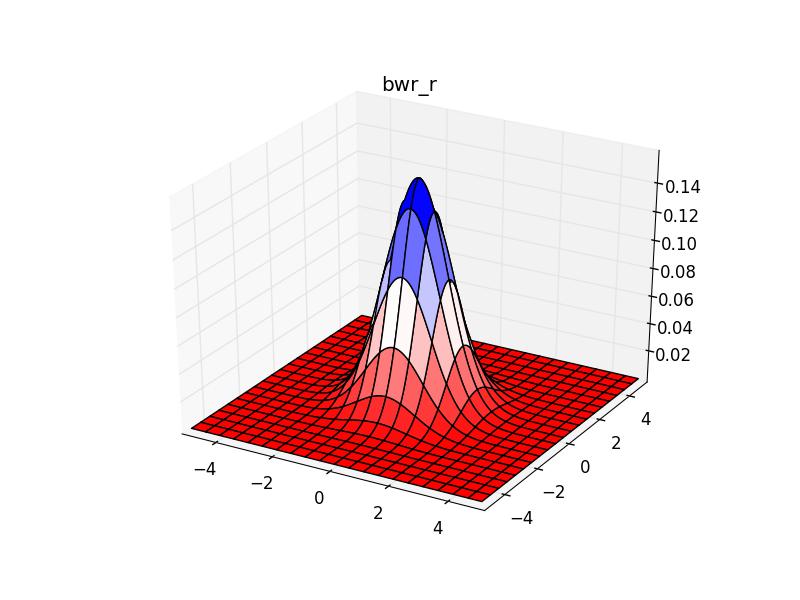
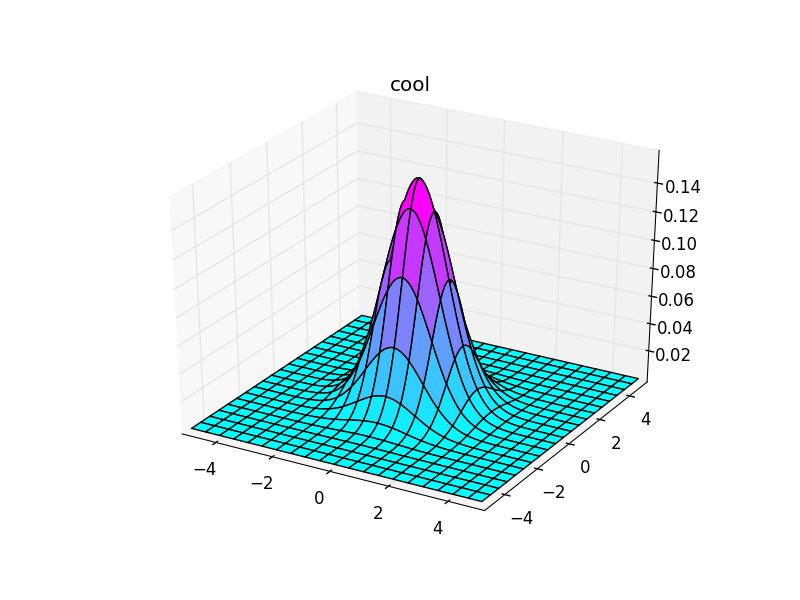
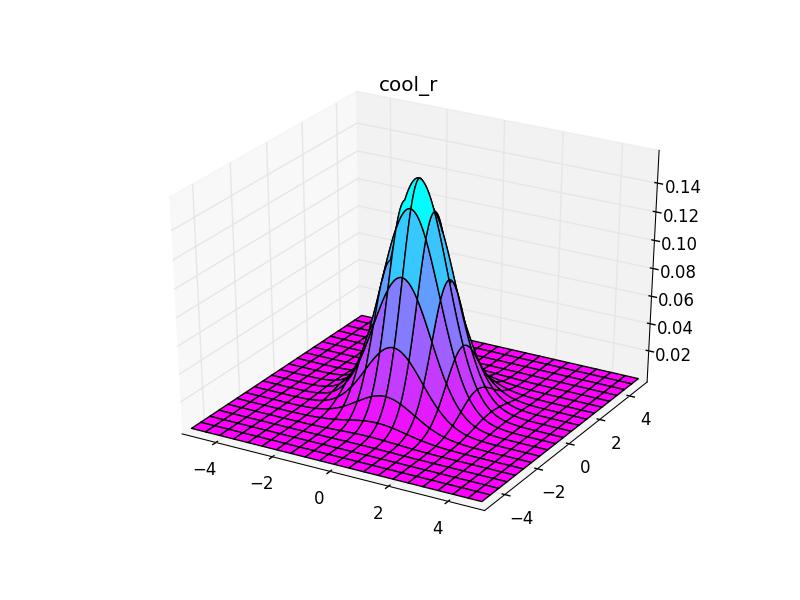
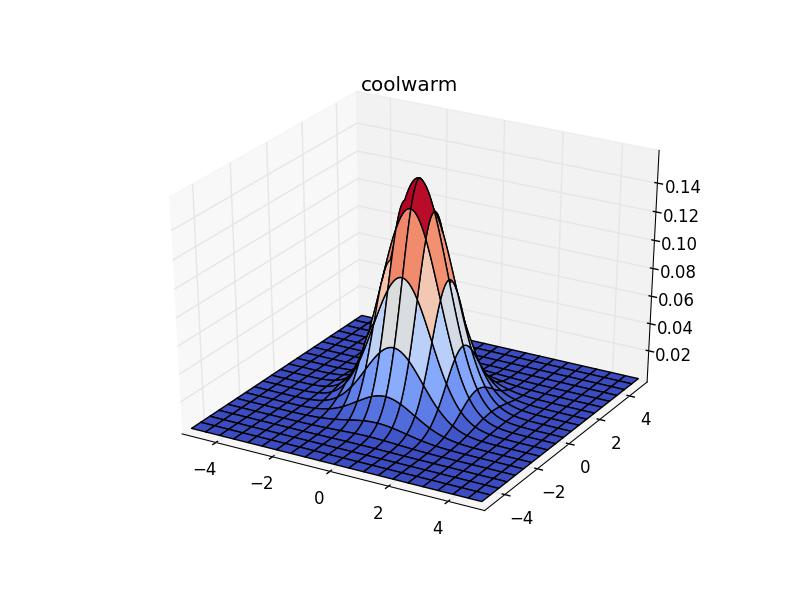
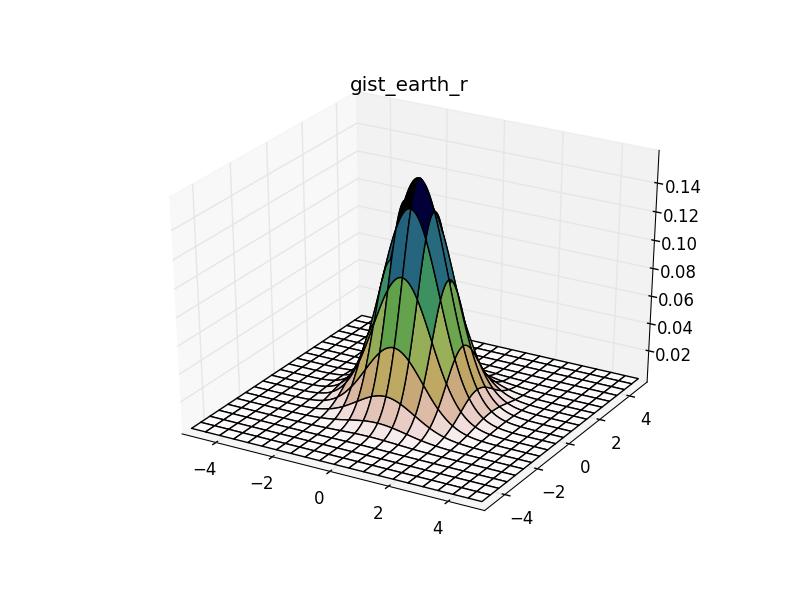
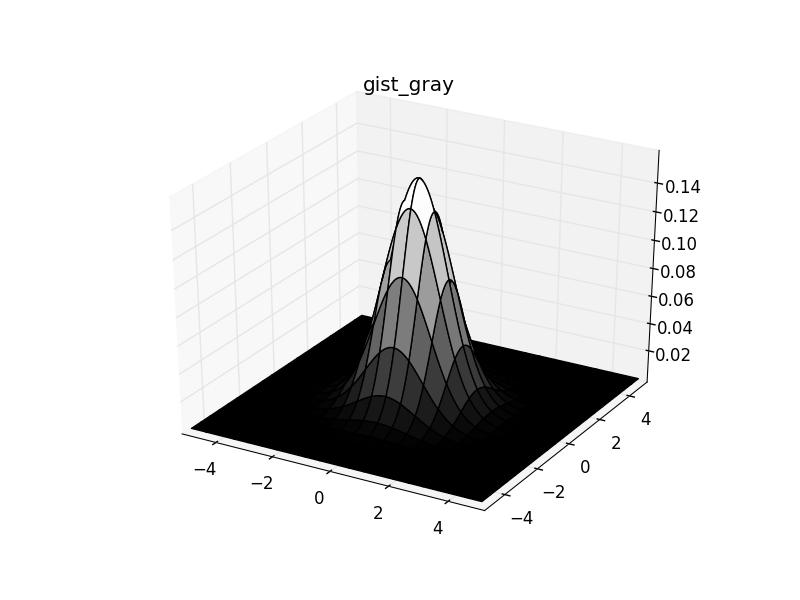
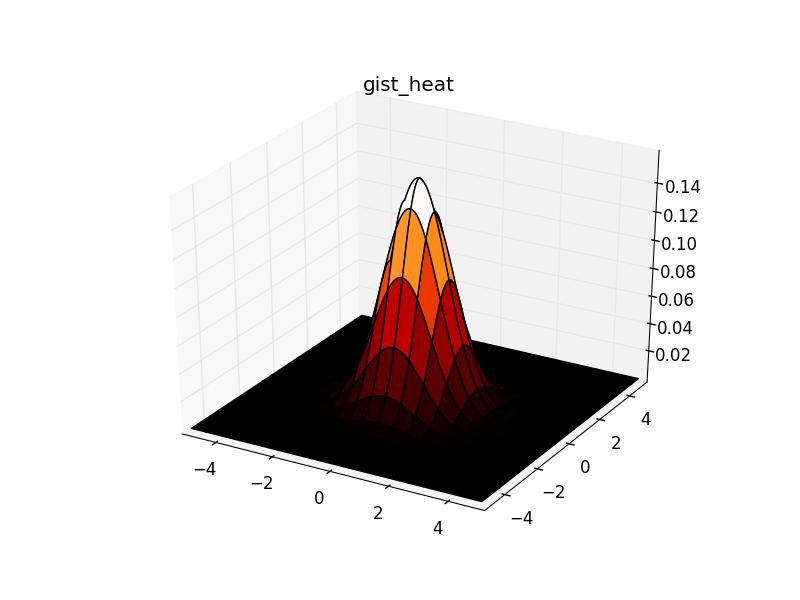
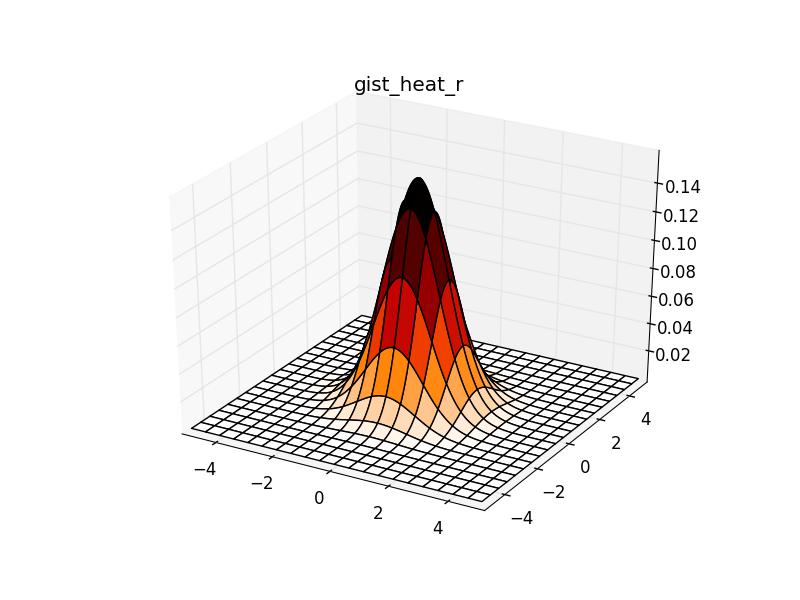
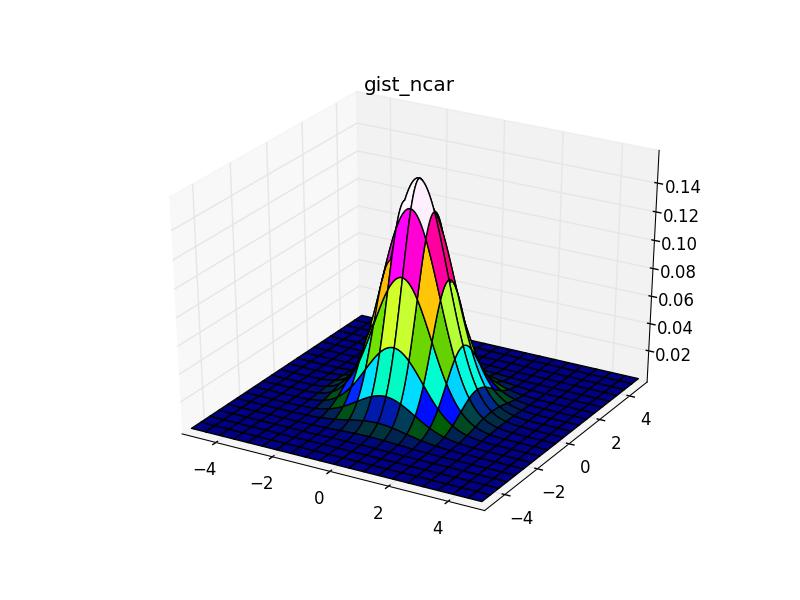
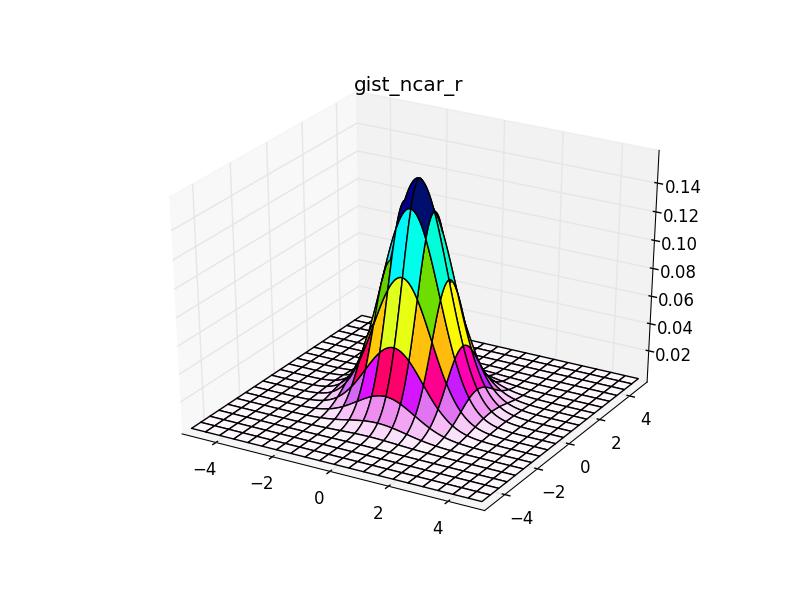
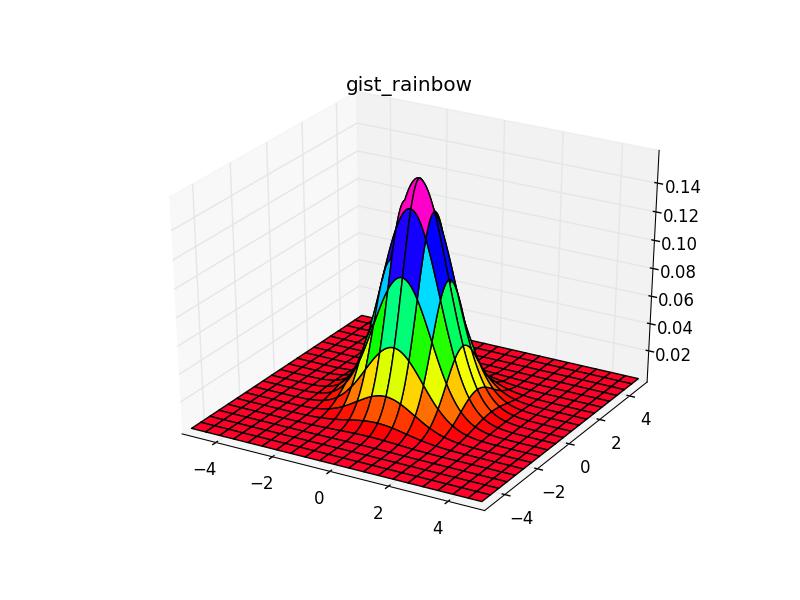
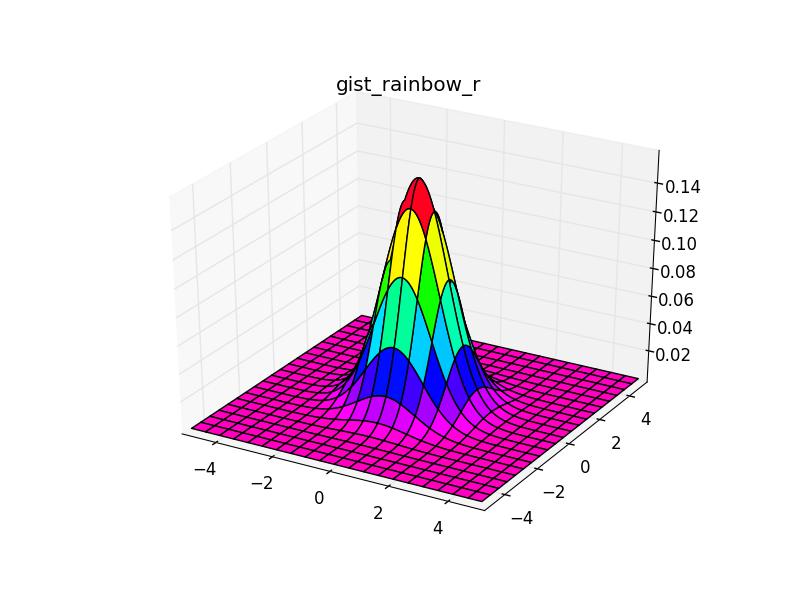
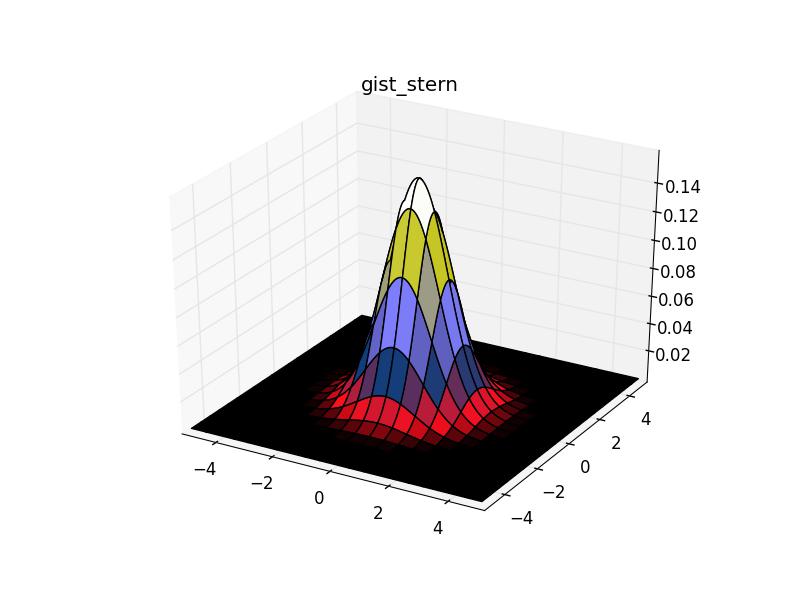
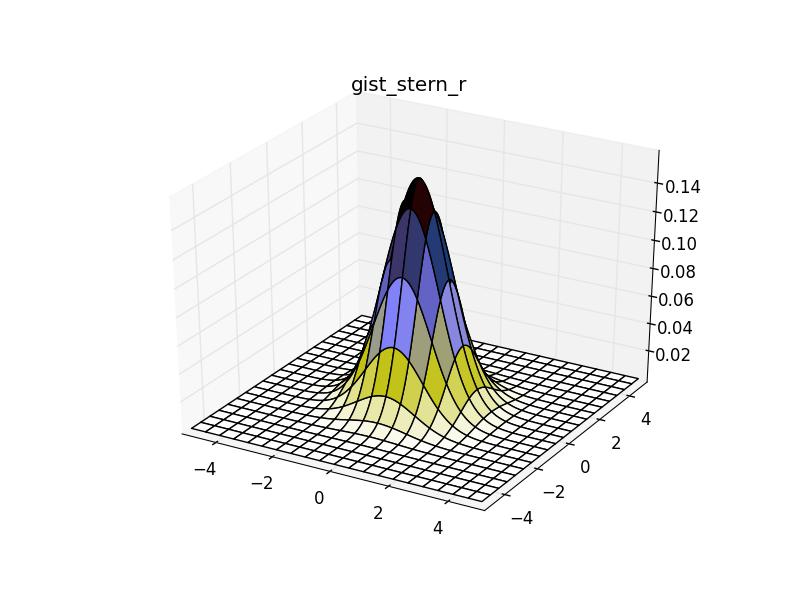
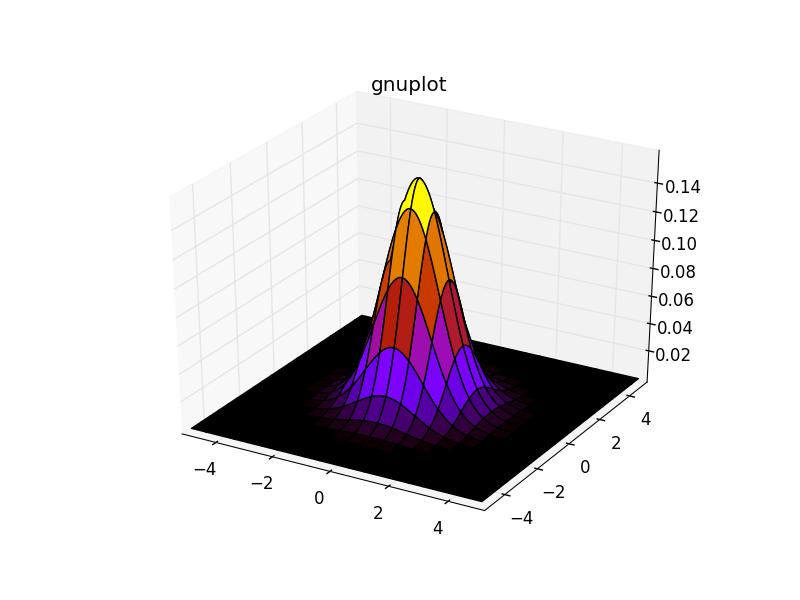
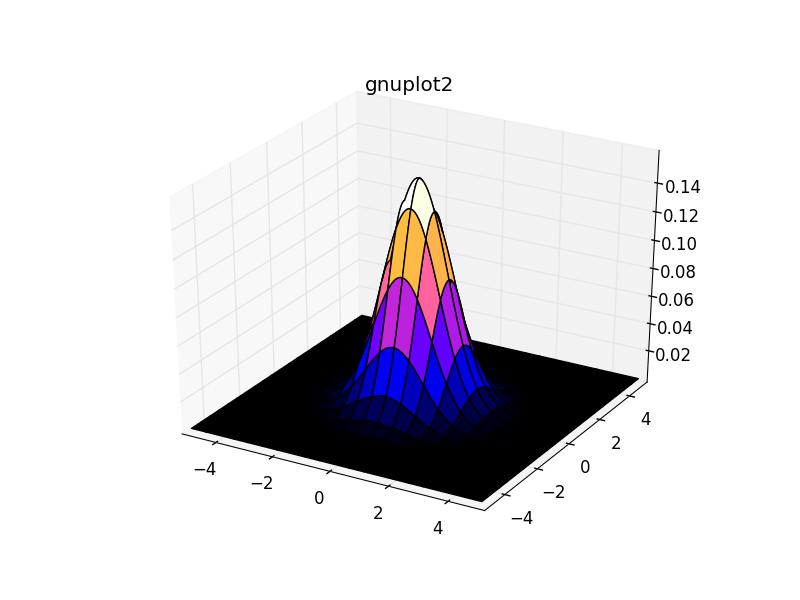
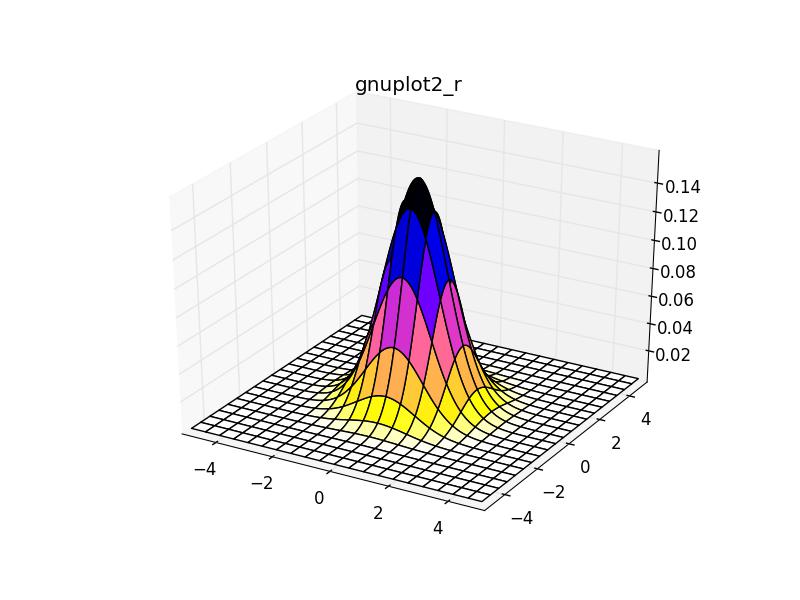
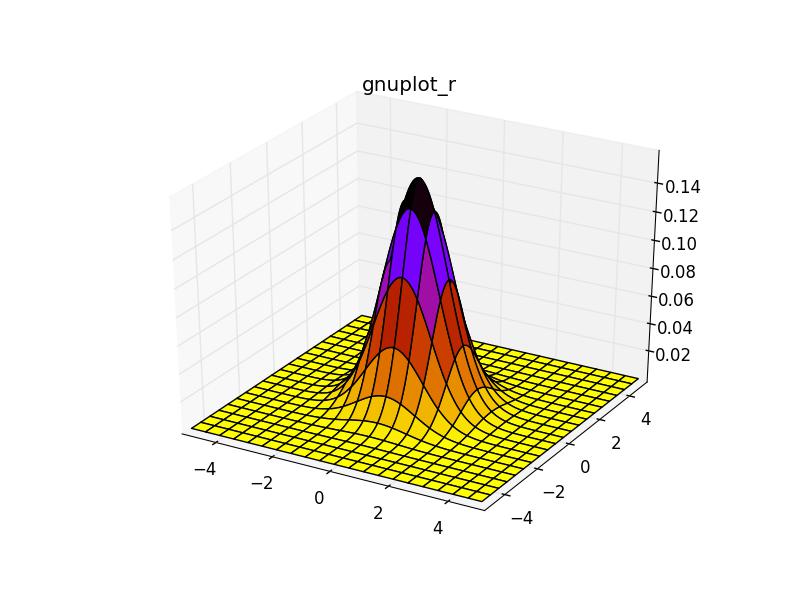
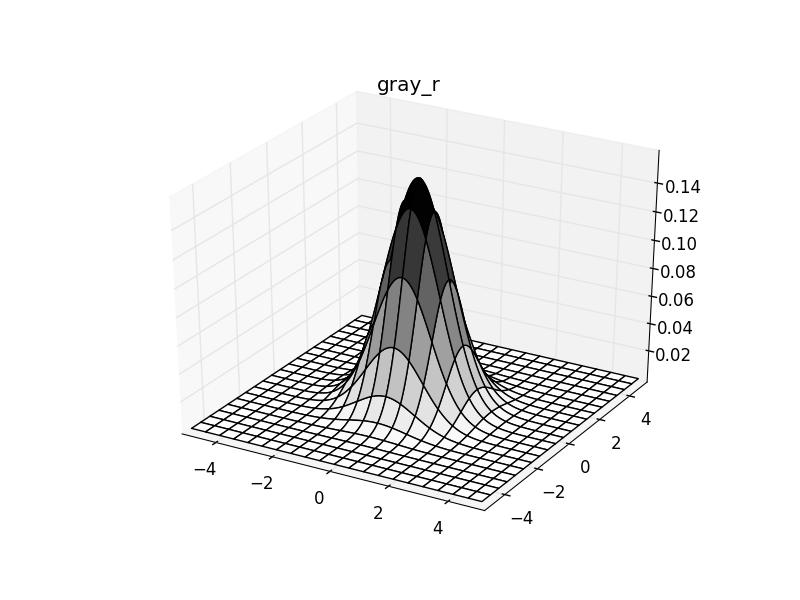
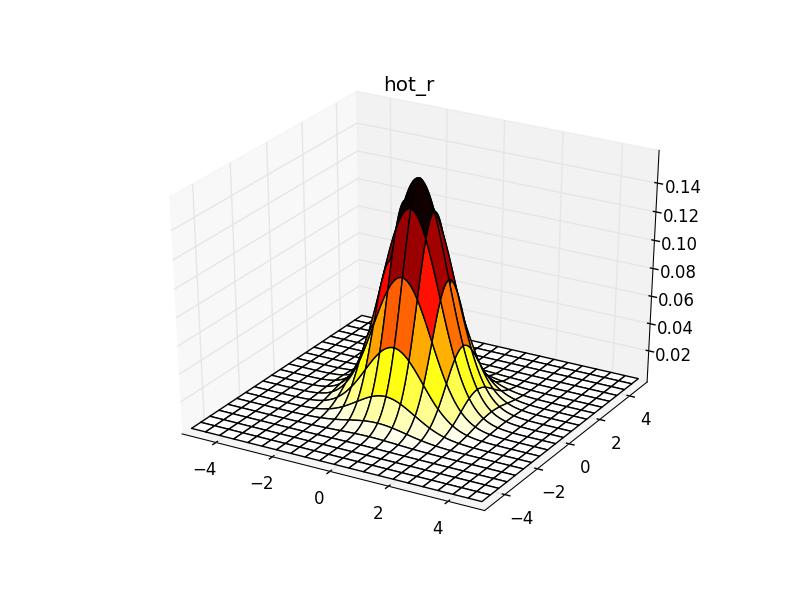
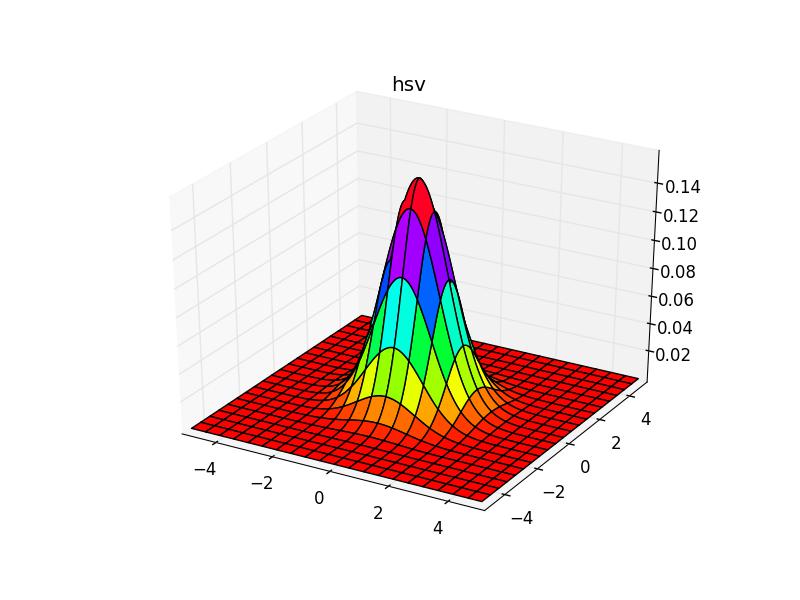
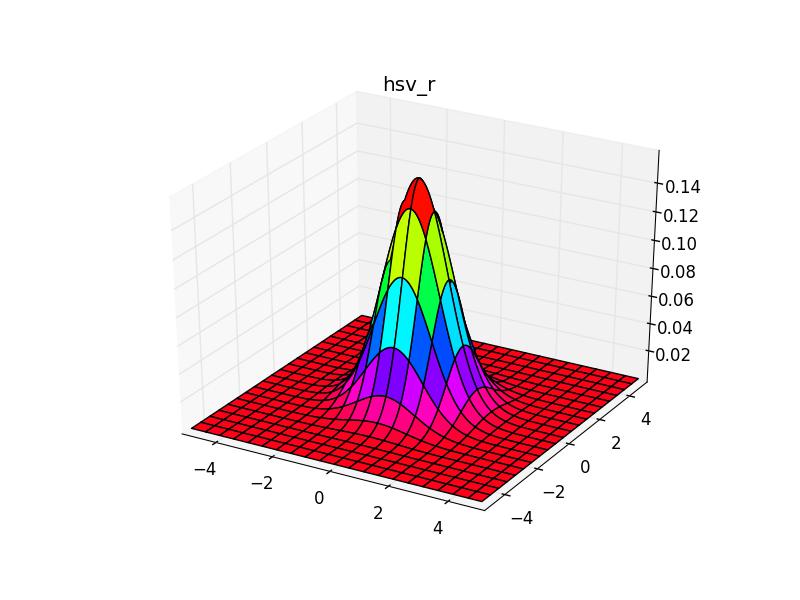
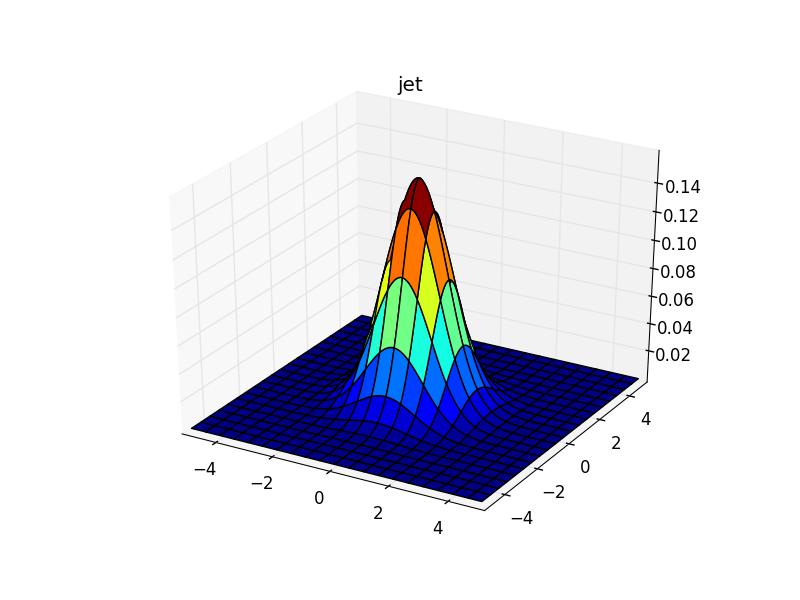
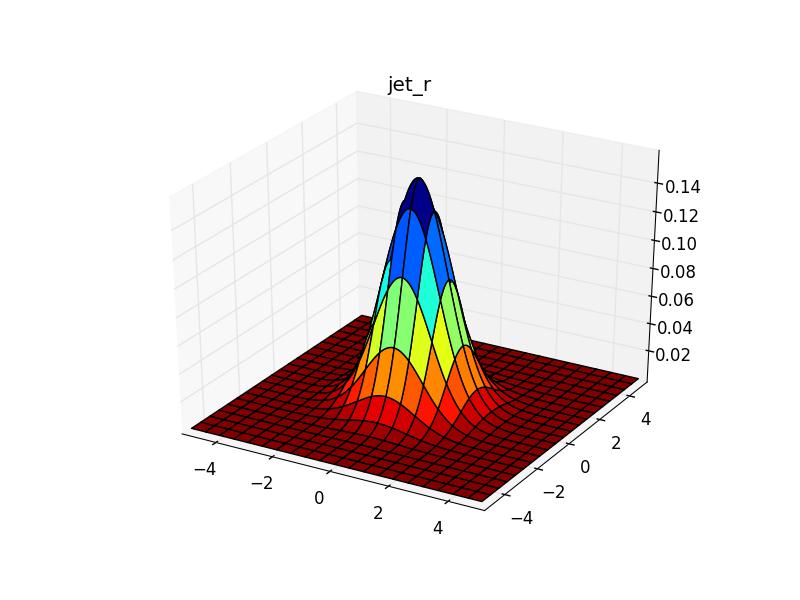
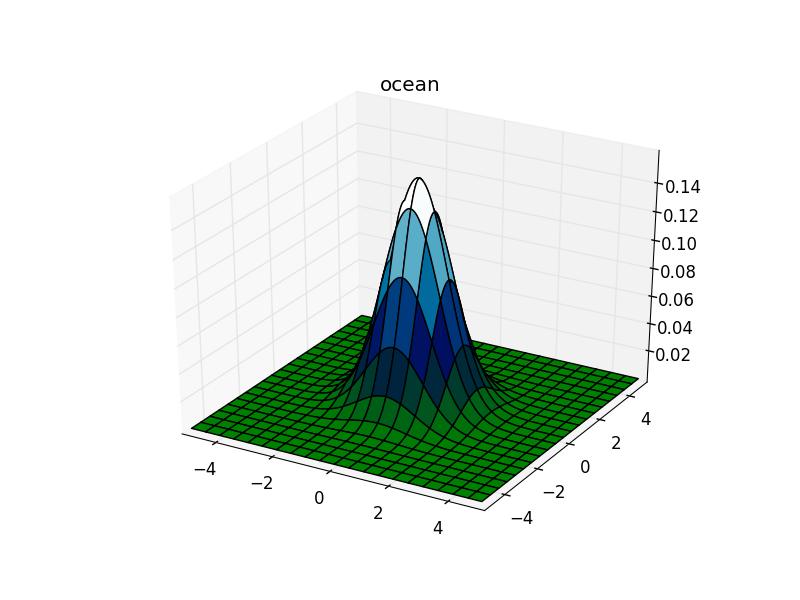
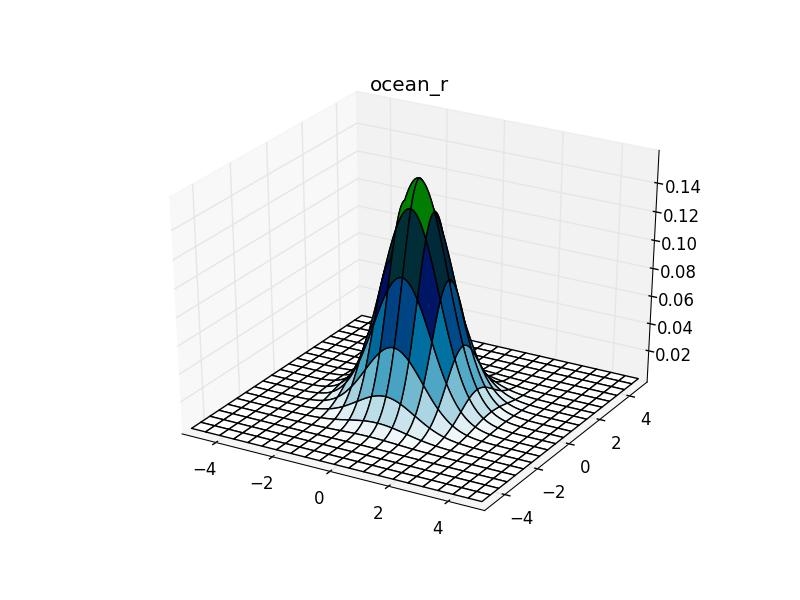
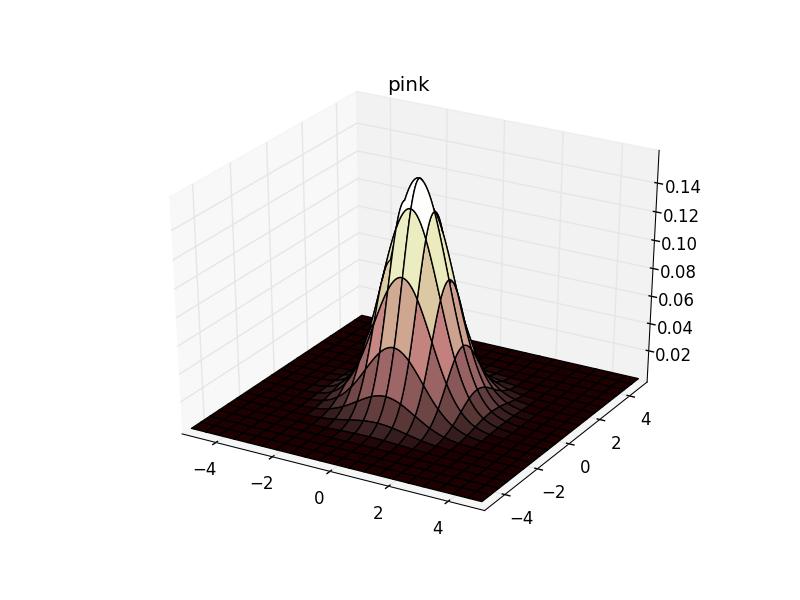
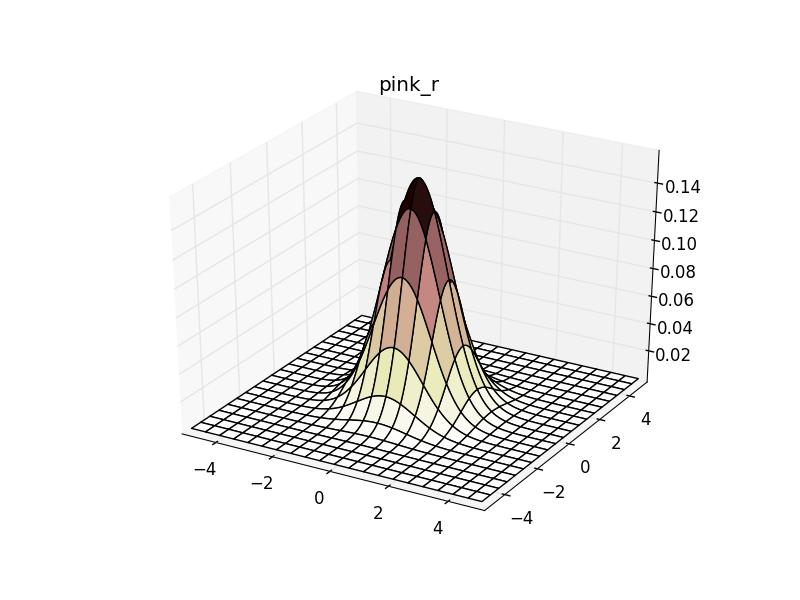
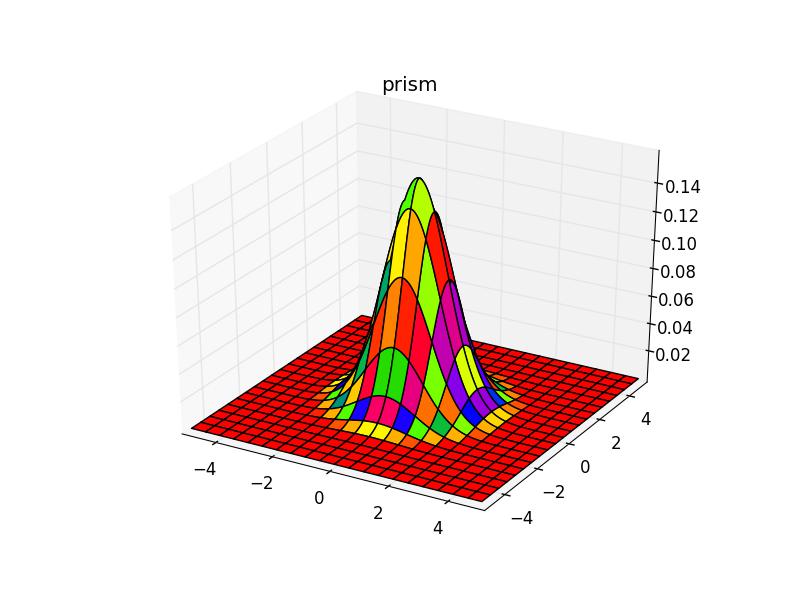
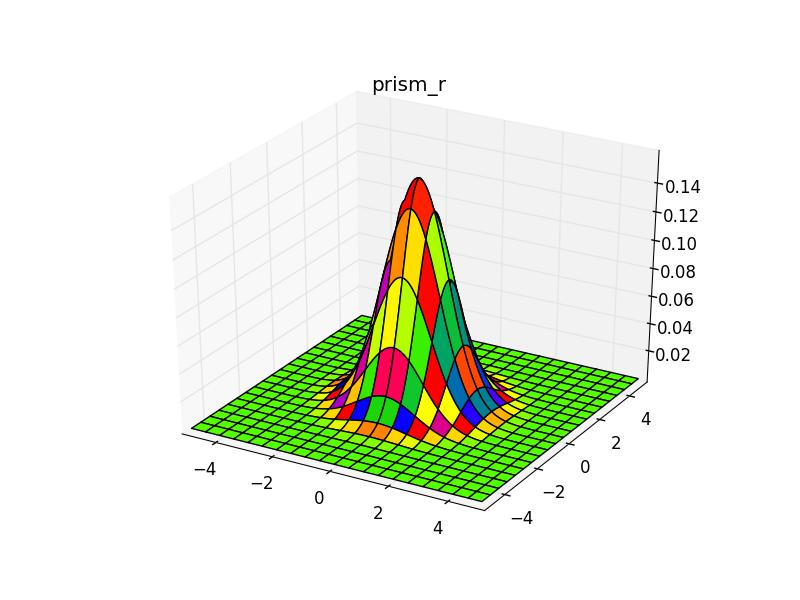
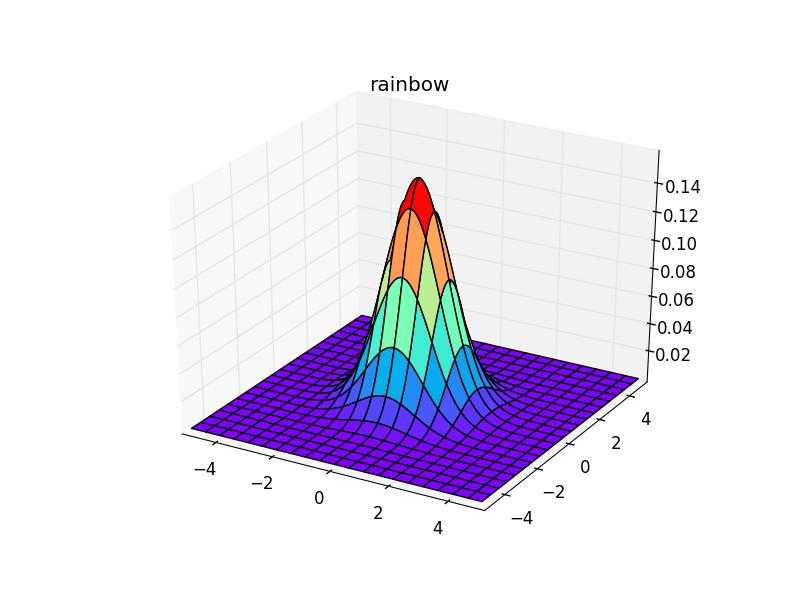
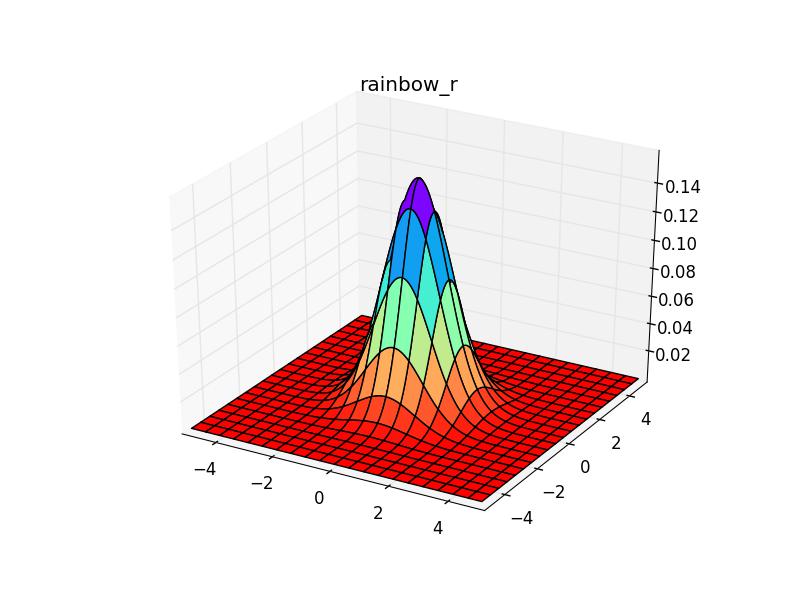
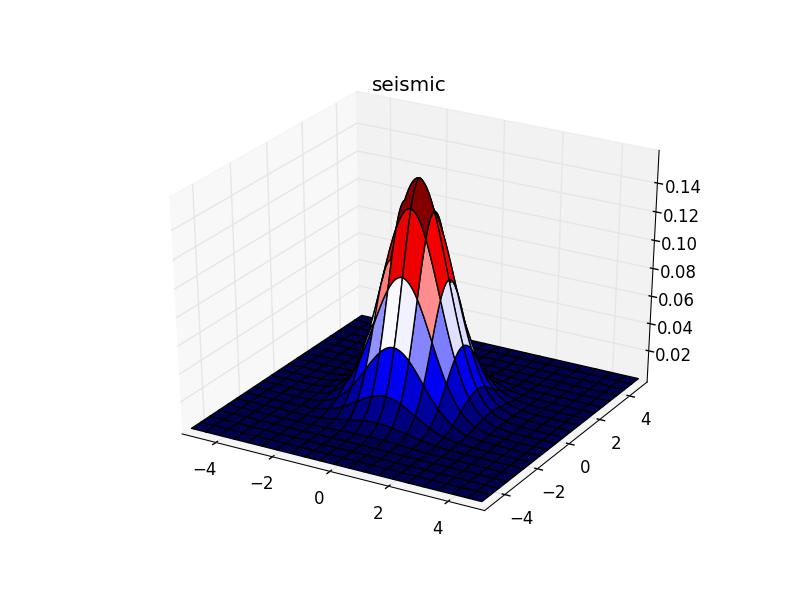
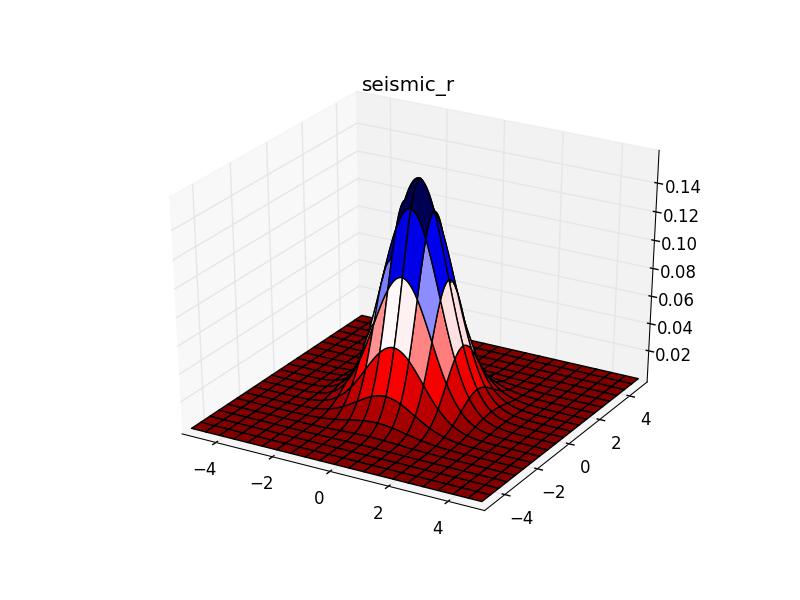
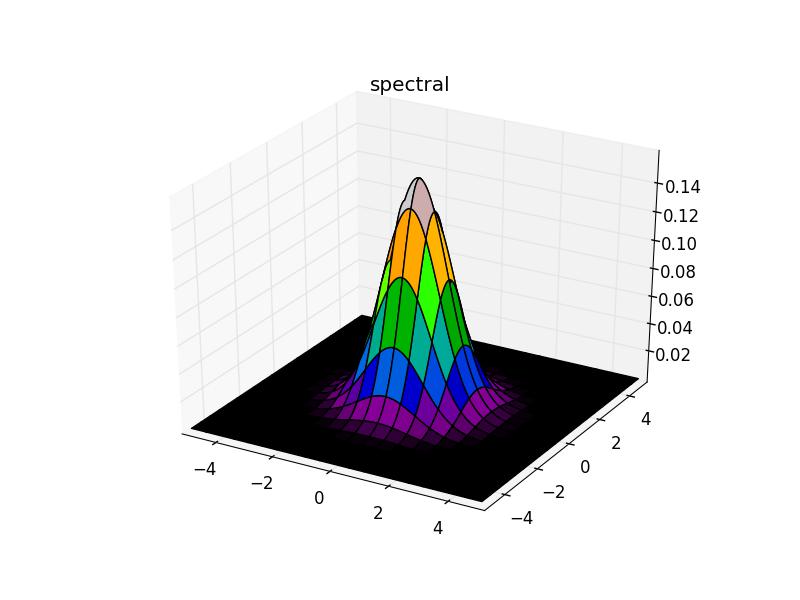
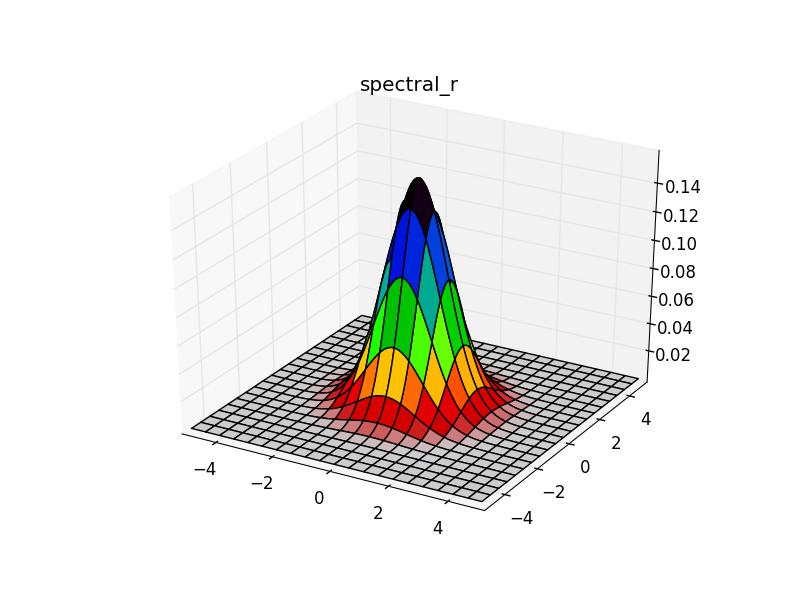
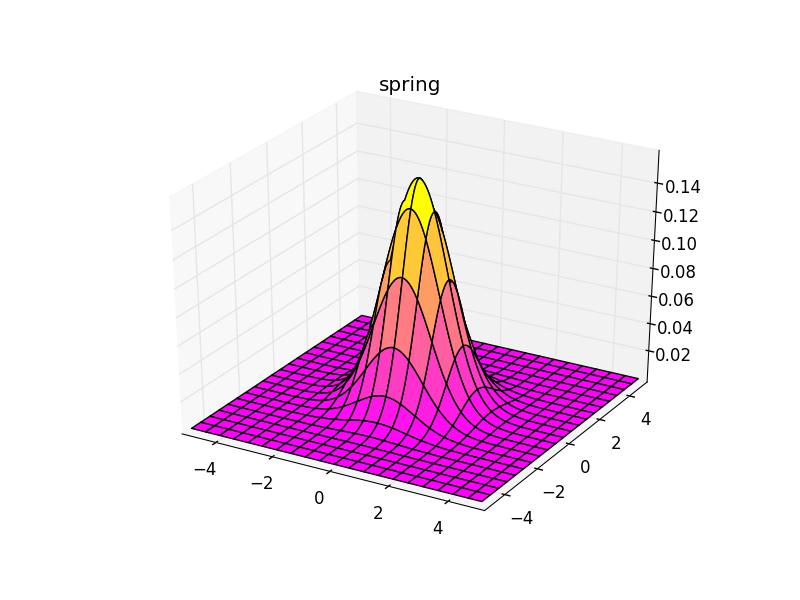
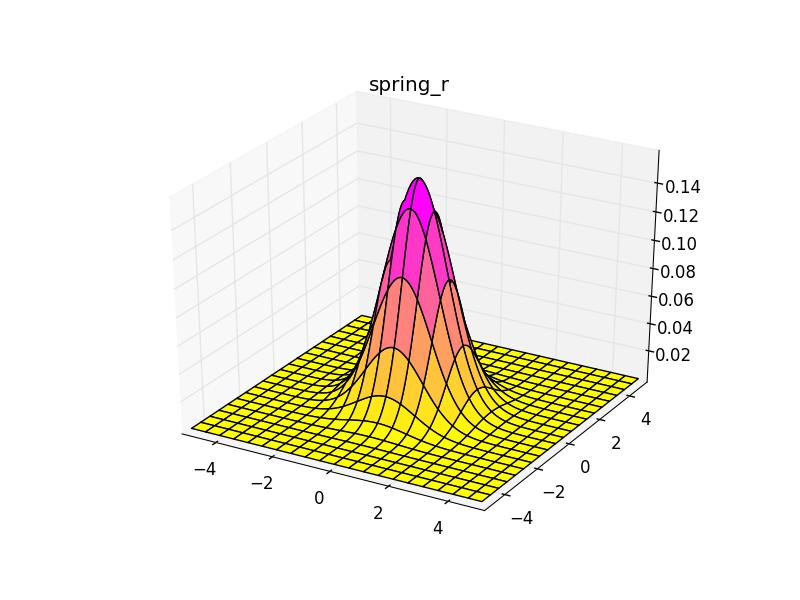
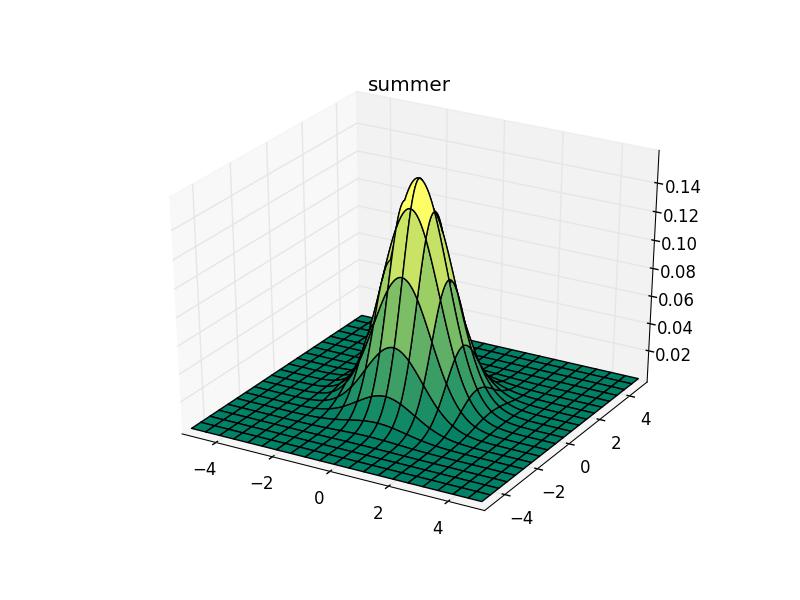
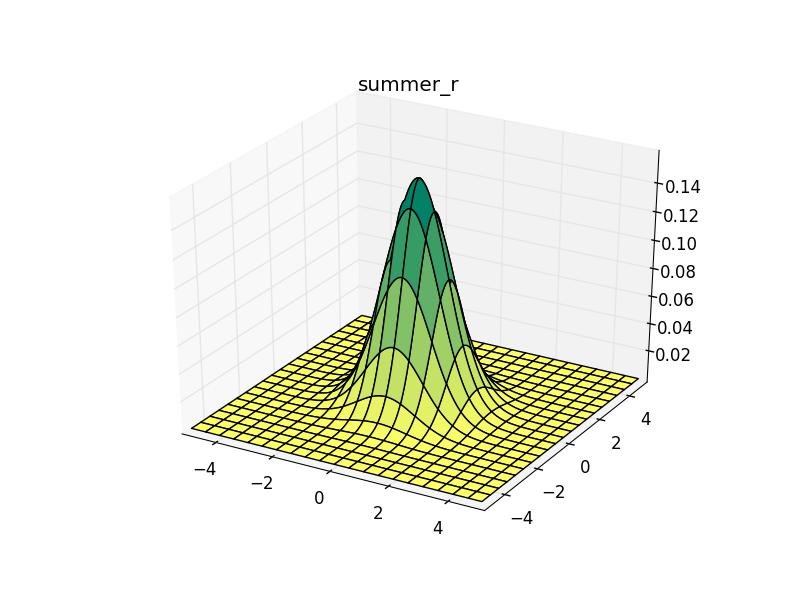
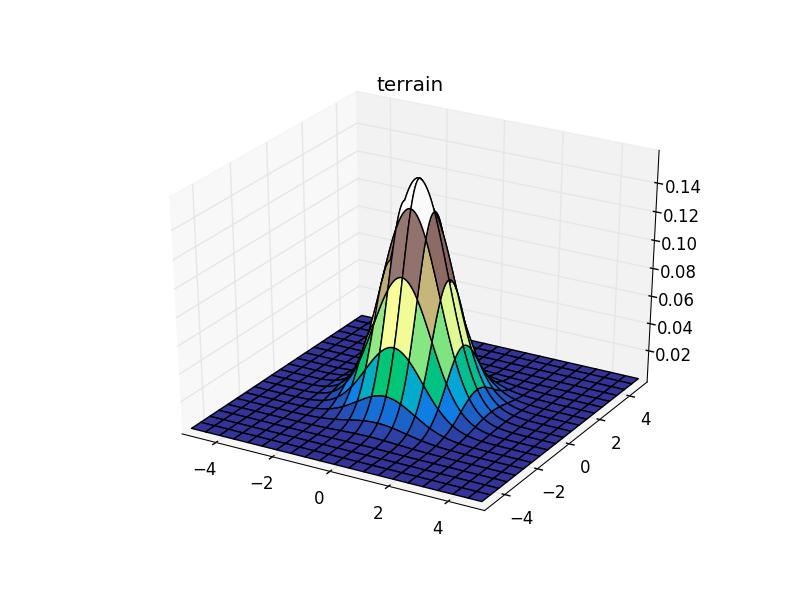
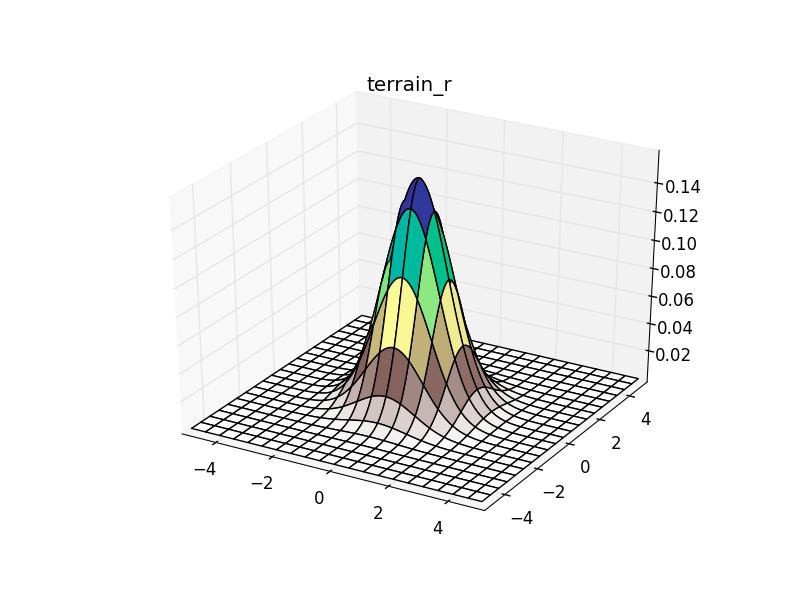
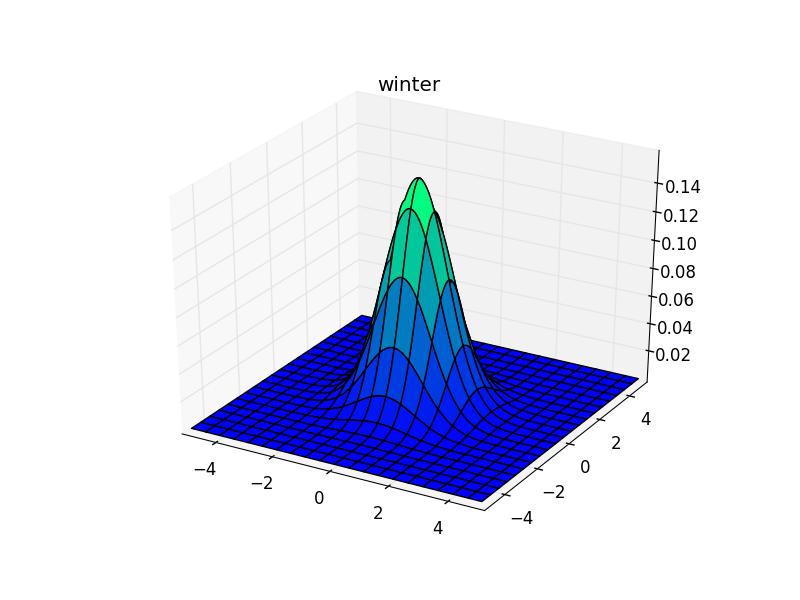
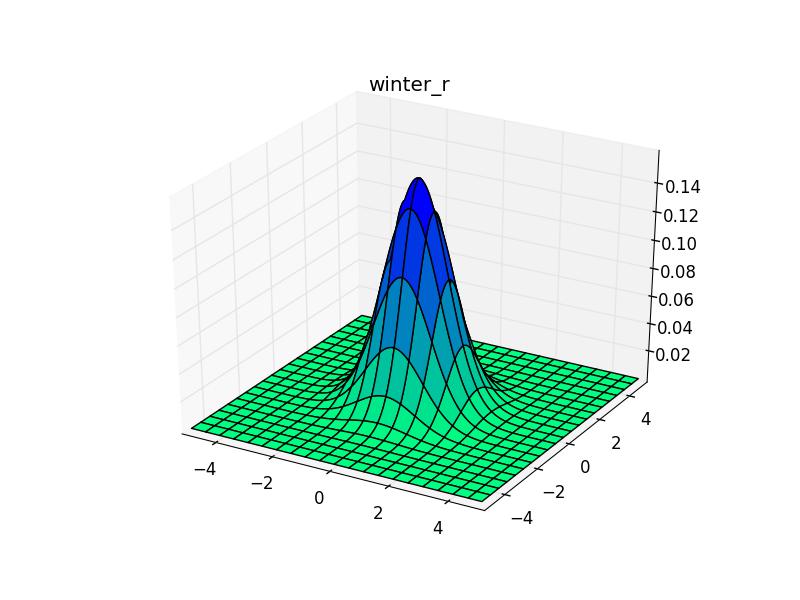
Below you’ll find a surface plot of a multivariate normal distribution plotted with every (n=140) colormap in Matplotlib 1.2.0. The name of the colormap is the title of each plot. This page was created using Pweave.
from pylab import *
from mpl_toolkits.mplot3d import Axes3D

x = linspace(-5, 5, 200)
y = x
X,Y = meshgrid(x, y)
Z = bivariate_normal(X, Y)

for cmap in colormaps():
    fig = figure()
    ax = fig.add_subplot(111, projection='3d')
    ax.plot_surface(X, Y, Z, cmap= cmap)
    title(cmap)